| Statistic | Value |
|---|---|
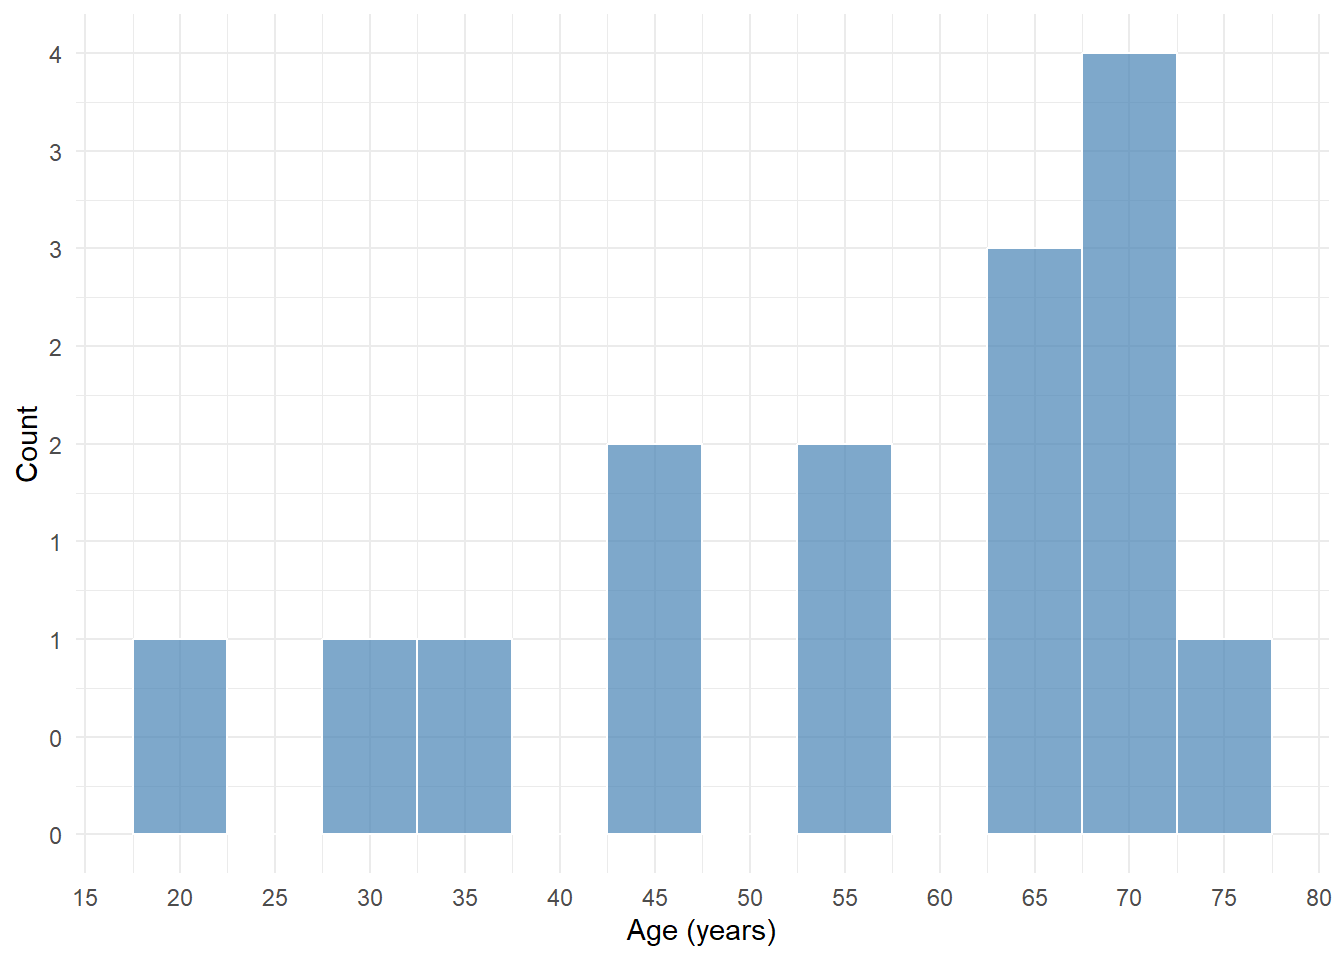
| Mean | 55.3 |
| Standard Deviation | 16.6 |
| Median | 63.0 |
| Minimum | 19.0 |
| Maximum | 76.0 |
Offline
Executive Summary
A pilot survey was conducted in July 2025 to test and refine the survey methodology. The study recruited 65 participants through two channels: 50 participants via the online platform Prolific and an additional convenience sample of 15 friends and family members of the research team. The purpose of the pilot was to evaluate the survey instrument and procedures prior to full-scale implementation.
Sample demographics
Age
Age groups
| Age Group | Count | Percentage |
|---|---|---|
| 16-24 | 1 | 6.2 |
| 25-34 | 1 | 6.2 |
| 35-44 | 1 | 6.2 |
| 45-54 | 4 | 25.0 |
| 55-64 | 2 | 12.5 |
| 65+ | 6 | 37.5 |
| NA | 1 | 6.2 |
Age distribution
Gender
| Gender | Count | Percentage |
|---|---|---|
| Female | 8 | 53.3 |
| Male | 7 | 46.7 |
Education
| Education Level | Count | Percentage |
|---|---|---|
| Vocational and technical (NVQ Level 1 and 2, BTEC, Apprenticeships, or equivalent) | 3 | 20.0 |
| Further education (A-Level, NVQ, Scottish Highers, or equivalent) | 1 | 6.7 |
| Higher education (HNC, HND, Foundational Degree, or equivalent) | 2 | 13.3 |
| Undergraduate Degree (BA, BSc, BEng, or equivalent) | 6 | 40.0 |
| Postgraduate and professional (MA, MSc, MBA, PhD, or equivalent) | 3 | 20.0 |
Ethnicity
| Ethnic Group | Count | Percentage |
|---|---|---|
| English/Welsh/Scottish/Northern Irish/British | 14 | 93.3 |
| Any other White Background | 1 | 6.7 |
Income
| Income Level | Count | Percentage |
|---|---|---|
| Less than £19,000 a year | 5 | 33.3 |
| £19,001 to £28,000 | 2 | 13.3 |
| £28,001 to £38,000 | 2 | 13.3 |
| £38,000 to £55,000 | 2 | 13.3 |
| More than £55,000 a year | 4 | 26.7 |
Item-Level Analysis
Item distribution analysis
Total survey items found: 49 Items with concerning distributions: 38 Percentage of items with issues: 77.6 %
Breakdown by severity:Critical : 4 items
High : 12 items
Moderate : 22 items
Mild : 0 items
Acceptable : 11 items| Statistic2 | Value2 |
|---|---|
| Average Item Mean | 4.59 |
| Average Item SD | 1.33 |
| Items with skewness |>1| | 18.00 |
| Items with Floor Effects (>15%) | 16.00 |
| Items with Ceiling Effects (>15%) | 25.00 |
| Items with Low Variance (SD<1) | 10.00 |
Definitions
Note
Severity Levels:
- Critical - Non-functional distributions that prevent meaningful analysis (100% at floor/ceiling, zero variance, severe skewness |>6|, only 1-2 response categories used)
- High - Major distribution problems requiring revision or removal (severe skewness |>2|, extreme floor/ceiling effects >40%, very low variance <0.70, extreme kurtosis |>4|, only 3 categories used, or ≥3 moderate issues)
- Moderate - Notable issues warranting monitoring (moderate skewness 1-2, moderate floor/ceiling effects 20-40%, low variance 0.70-1.0, high kurtosis 3-4, or 2+ mild issues)
- Mild - Minor concerns but likely acceptable (mild skewness 1-1.5, mild floor/ceiling effects 15-20%, borderline variance 0.90-1.0)
- Acceptable - No significant distribution issues
Statistical Terms: * Floor effect - Large percentage selecting minimum response option * Ceiling effect - Large percentage selecting maximum response option
* Skewness - Asymmetry of distribution (±1 acceptable, ±2+ severe) * Kurtosis - Concentration of responses in tails vs. normal distribution
Recommendations by severity
| Severity.Level | Count | Recommendation |
|---|---|---|
| Critical | 4 items | Strong candidate for removal or major revision |
| High | 12 items | Strong candidates for removal or major revision |
| Moderate | 22 items | Monitor and consider minor revisions |
#### Items requiring attention:

**Item_6** (High severity):
- Mean: 6.6 , SD: 0.63 , Skewness: -1.14
- Floor effect: 6.7 %, Ceiling effect: 66.7 %
- Issues: moderate negative skew (-1.14); ceiling effect (66.7% at maximum); low variance (SD = 0.63); limited range usage (only 3 response categories used)

**Item_13** (High severity):
- Mean: 1.73 , SD: 1.33 , Skewness: 2.14
- Floor effect: 60 %, Ceiling effect: 6.7 %
- Issues: severe positive skew (2.14); floor effect (60% at minimum); high kurtosis (4.07)

**Item_18** (High severity):
- Mean: 5.6 , SD: 1.92 , Skewness: -1.22
- Floor effect: 6.7 %, Ceiling effect: 46.7 %
- Issues: moderate negative skew (-1.22); ceiling effect (46.7% at maximum)

**Item_21** (High severity):
- Mean: 5.2 , SD: 0.77 , Skewness: -1.17
- Floor effect: 6.7 %, Ceiling effect: 33.3 %
- Issues: moderate negative skew (-1.17); ceiling effect (33.3% at maximum); low variance (SD = 0.77); limited range usage (only 3 response categories used)

**Item_22** (Critical severity):
- Mean: 1 , SD: 0 , Skewness: NaN
- Floor effect: 100 %, Ceiling effect: 100 %
- Issues: floor effect (100% at minimum); ceiling effect (100% at maximum); low variance (SD = 0); limited range usage (only 1 response categories used)

**Item_23** (Critical severity):
- Mean: 7 , SD: 0 , Skewness: NaN
- Floor effect: 100 %, Ceiling effect: 100 %
- Issues: floor effect (100% at minimum); ceiling effect (100% at maximum); low variance (SD = 0); limited range usage (only 1 response categories used)

**Item_24** (High severity):
- Mean: 6.33 , SD: 0.62 , Skewness: -0.25
- Floor effect: 6.7 %, Ceiling effect: 40 %
- Issues: ceiling effect (40% at maximum); low variance (SD = 0.62); limited range usage (only 3 response categories used)

**Item_25** (High severity):
- Mean: 6.2 , SD: 0.94 , Skewness: -0.84
- Floor effect: 6.7 %, Ceiling effect: 46.7 %
- Issues: ceiling effect (46.7% at maximum); low variance (SD = 0.94)

**Item_27** (High severity):
- Mean: 5.4 , SD: 2.13 , Skewness: -0.95
- Floor effect: 6.7 %, Ceiling effect: 46.7 %
- Issues: ceiling effect (46.7% at maximum)

**Item_31** (High severity):
- Mean: 2.07 , SD: 1.49 , Skewness: 1.36
- Floor effect: 46.7 %, Ceiling effect: 6.7 %
- Issues: moderate positive skew (1.36); floor effect (46.7% at minimum)

**Item_32** (High severity):
- Mean: 2 , SD: 1.69 , Skewness: 1.66
- Floor effect: 53.3 %, Ceiling effect: 13.3 %
- Issues: moderate positive skew (1.66); floor effect (53.3% at minimum); limited range usage (only 3 response categories used)

**Item_34** (High severity):
- Mean: 2.27 , SD: 1.58 , Skewness: 0.91
- Floor effect: 46.7 %, Ceiling effect: 6.7 %
- Issues: floor effect (46.7% at minimum)

**Item_37** (High severity):
- Mean: 2.27 , SD: 1.87 , Skewness: 1.23
- Floor effect: 53.3 %, Ceiling effect: 6.7 %
- Issues: moderate positive skew (1.23); floor effect (53.3% at minimum)

**Item_43** (High severity):
- Mean: 2.07 , SD: 1.44 , Skewness: 1.37
- Floor effect: 46.7 %, Ceiling effect: 6.7 %
- Issues: moderate positive skew (1.37); floor effect (46.7% at minimum)

**Item_48** (Critical severity):
- Mean: 7 , SD: 0 , Skewness: NaN
- Floor effect: 100 %, Ceiling effect: 100 %
- Issues: floor effect (100% at minimum); ceiling effect (100% at maximum); low variance (SD = 0); limited range usage (only 1 response categories used)

**Item_49** (Critical severity):
- Mean: 1 , SD: 0 , Skewness: NaN
- Floor effect: 100 %, Ceiling effect: 100 %
- Issues: floor effect (100% at minimum); ceiling effect (100% at maximum); low variance (SD = 0); limited range usage (only 1 response categories used)
Concerning items with wording
Found 38 items with distribution concerns:| Item | Item Wording | Distribution Issues | Severity | Suggested Revision |
|---|---|---|---|---|
| Item_22 | Select Strongly Disagree for this question. | floor effect (100% at minimum); ceiling effect (100% at maximum); low variance (SD = 0); limited range usage (only 1 response categories used) | Critical | Consider revising to increase response variability |
| Item_23 | Select Strongly Agree for this question. | floor effect (100% at minimum); ceiling effect (100% at maximum); low variance (SD = 0); limited range usage (only 1 response categories used) | Critical | Consider revising to increase response variability |
| Item_48 | Select Strongly Agree for this question. | floor effect (100% at minimum); ceiling effect (100% at maximum); low variance (SD = 0); limited range usage (only 1 response categories used) | Critical | Consider revising to increase response variability |
| Item_49 | Select Strongly Disagree for this question. | floor effect (100% at minimum); ceiling effect (100% at maximum); low variance (SD = 0); limited range usage (only 1 response categories used) | Critical | Consider revising to increase response variability |
| Item_13 | I don’t have anyone in my life that could help me use a health technology. | severe positive skew (2.14); floor effect (60% at minimum); high kurtosis (4.07) | High | Major revision needed - consider rewording or replacement |
| Item_18 | I would expect health technologies to have measures in place to keep my information safe. | moderate negative skew (-1.22); ceiling effect (46.7% at maximum) | High | Consider major revision or replacement |
| Item_21 | I would trust a new health technology with information about my health conditions. | moderate negative skew (-1.17); ceiling effect (33.3% at maximum); low variance (SD = 0.77); limited range usage (only 3 response categories used) | High | Consider revising to increase response variability; Simplify to 3-point scale or revise to encourage full range usage |
| Item_24 | I am confident I could learn how to use a fitness app if I wanted to. | ceiling effect (40% at maximum); low variance (SD = 0.62); limited range usage (only 3 response categories used) | High | Consider adding more challenging scenarios or higher difficulty levels; Consider revising to increase response variability; Simplify to 3-point scale or revise to encourage full range usage |
| Item_25 | I am confident I could use a fitness app to monitor my health if I wanted to. | ceiling effect (46.7% at maximum); low variance (SD = 0.94) | High | Consider adding more challenging scenarios or higher difficulty levels; Consider revising to increase response variability |
| Item_27 | I am confident I could use a fitness app without help if I wanted to. | ceiling effect (46.7% at maximum) | High | Consider adding more challenging scenarios or higher difficulty levels |
| Item_31 | Because I am not interested in using technology to support my health, I wouldn’t use a fitness app. | moderate positive skew (1.36); floor effect (46.7% at minimum) | High | Consider major revision or replacement |
| Item_32 | I wouldn’t use a a fitness app because I find technology frustrating. | moderate positive skew (1.66); floor effect (53.3% at minimum); limited range usage (only 3 response categories used) | High | Simplify to 3-point scale or revise to encourage full range usage |
| Item_34 | I would use a fitness app because I don’t want to let others down. | floor effect (46.7% at minimum) | High | Consider major revision or replacement |
| Item_37 | I would use a fitness app because I would feel guilty if I didn’t. | moderate positive skew (1.23); floor effect (53.3% at minimum) | High | Consider major revision or replacement |
| Item_43 | I don’t think a fitness app would work for me. | moderate positive skew (1.37); floor effect (46.7% at minimum) | High | Consider major revision or replacement |
| Item_6 | I can usually download apps. | moderate negative skew (-1.14); ceiling effect (66.7% at maximum); low variance (SD = 0.63); limited range usage (only 3 response categories used) | High | Consider revising to increase response variability; Simplify to 3-point scale or revise to encourage full range usage |
| Item_1 | I would understand what a health technology was asking me to do to improve my health. | moderate negative skew (-1.57); ceiling effect (33.3% at maximum) | Moderate | Monitor and consider minor wording adjustments |
| Item_10 | I can usually adjust the settings on digital technology to suit my needs. | ceiling effect (20% at maximum) | Moderate | Monitor and consider minor wording adjustments |
| Item_11 | Those close to me would encourage me to use a new health technology. | floor effect (20% at minimum) | Moderate | Monitor and consider minor wording adjustments |
| Item_12 | Those close to me would help me use a new health technology if needed. | moderate negative skew (-1.58); ceiling effect (33.3% at maximum) | Moderate | Monitor and consider minor wording adjustments |
| Item_16 | Others would be pleased I was using a health technology. | floor effect (20% at minimum) | Moderate | Monitor and consider minor wording adjustments |
| Item_20 | I worry that using a new health technology would put me at risk of fraud. | moderate positive skew (1.1); floor effect (40% at minimum) | Moderate | Monitor and consider minor wording adjustments |
| Item_26 | I am confident I could use a fitness app regularly if I wanted to. | moderate negative skew (-1.11); ceiling effect (33.3% at maximum) | Moderate | Consider adding more challenging scenarios or higher difficulty levels |
| Item_28 | I am confident I could troubleshoot basic issues with a fitness app if I wanted to. | moderate negative skew (-1.08) | Moderate | Monitor and consider minor wording adjustments |
| Item_29 | I am confident I could use the advanced features of a fitness app if I wanted to. | moderate negative skew (-1.04); ceiling effect (20% at maximum) | Moderate | Consider adding more challenging scenarios or higher difficulty levels |
| Item_30 | I would use a fitness app because I want to learn about my health. | floor effect (26.7% at minimum); ceiling effect (33.3% at maximum) | Moderate | Monitor and consider minor wording adjustments |
| Item_33 | I would use a fitness app because I am motivated to improve my health. | moderate negative skew (-1.2); ceiling effect (26.7% at maximum) | Moderate | Monitor and consider minor wording adjustments |
| Item_35 | I would enjoy using a fitness app to improve my health. | ceiling effect (20% at maximum) | Moderate | Monitor and consider minor wording adjustments |
| Item_38 | I can’t see why I should bother using a fitness app. | moderate positive skew (1.08); floor effect (33.3% at minimum) | Moderate | Monitor and consider minor wording adjustments |
| Item_39 | I would use a fitness app if told to by health professionals. | ceiling effect (26.7% at maximum); low variance (SD = 0.92) | Moderate | Consider revising to increase response variability |
| Item_4 | I would understand information about my health from health technologies. | ceiling effect (20% at maximum); low variance (SD = 0.86) | Moderate | Consider revising to increase response variability |
| Item_41 | I would get a sense of accomplishment if I used a fitness app. | ceiling effect (20% at maximum) | Moderate | Monitor and consider minor wording adjustments |
| Item_42 | I believe that using a fitness app would improve my physical health. | ceiling effect (20% at maximum) | Moderate | Monitor and consider minor wording adjustments |
| Item_44 | I believe that using a fitness app would be good for me. | ceiling effect (26.7% at maximum) | Moderate | Monitor and consider minor wording adjustments |
| Item_5 | I would know which health technology was right for me. | ceiling effect (33.3% at maximum) | Moderate | Monitor and consider minor wording adjustments |
| Item_7 | I can usually use digital technology. | moderate negative skew (-1.78); ceiling effect (40% at maximum) | Moderate | Monitor and consider minor wording adjustments |
| Item_8 | I can troubleshoot basic issues with digital technology. | moderate negative skew (-1.32) | Moderate | Monitor and consider minor wording adjustments |
| Item_9 | I often struggle to use digital technology. | floor effect (26.7% at minimum) | Moderate | Consider softer language or lower barriers to agreement |
#### Summary by Severity Level:| Severity Level | Count | Items |
|---|---|---|
| Critical | 4 | Item_22, Item_23, Item_48, Item_49 |
| High | 12 | Item_13, Item_18, Item_21, Item_24, Item_25, Item_27, Item_31, Item_32, Item_34, Item_37, Item_43, Item_6 |
| Moderate | 22 | Item_1, Item_10, Item_11, Item_12, Item_16, Item_20, Item_26, Item_28, Item_29, Item_30, Item_33, Item_35, Item_38, Item_39, Item_4, Item_41, Item_42, Item_44, Item_5, Item_7, Item_8, Item_9 |
#### Most Common Distribution Issues:| Issue Type | Number of Items |
|---|---|
| Ceiling Effects | 25 |
| Skewness | 18 |
| Floor Effects | 16 |
| Low Variance | 10 |
| Limited Range | 8 |
| Kurtosis | 1 |
#### A worked example
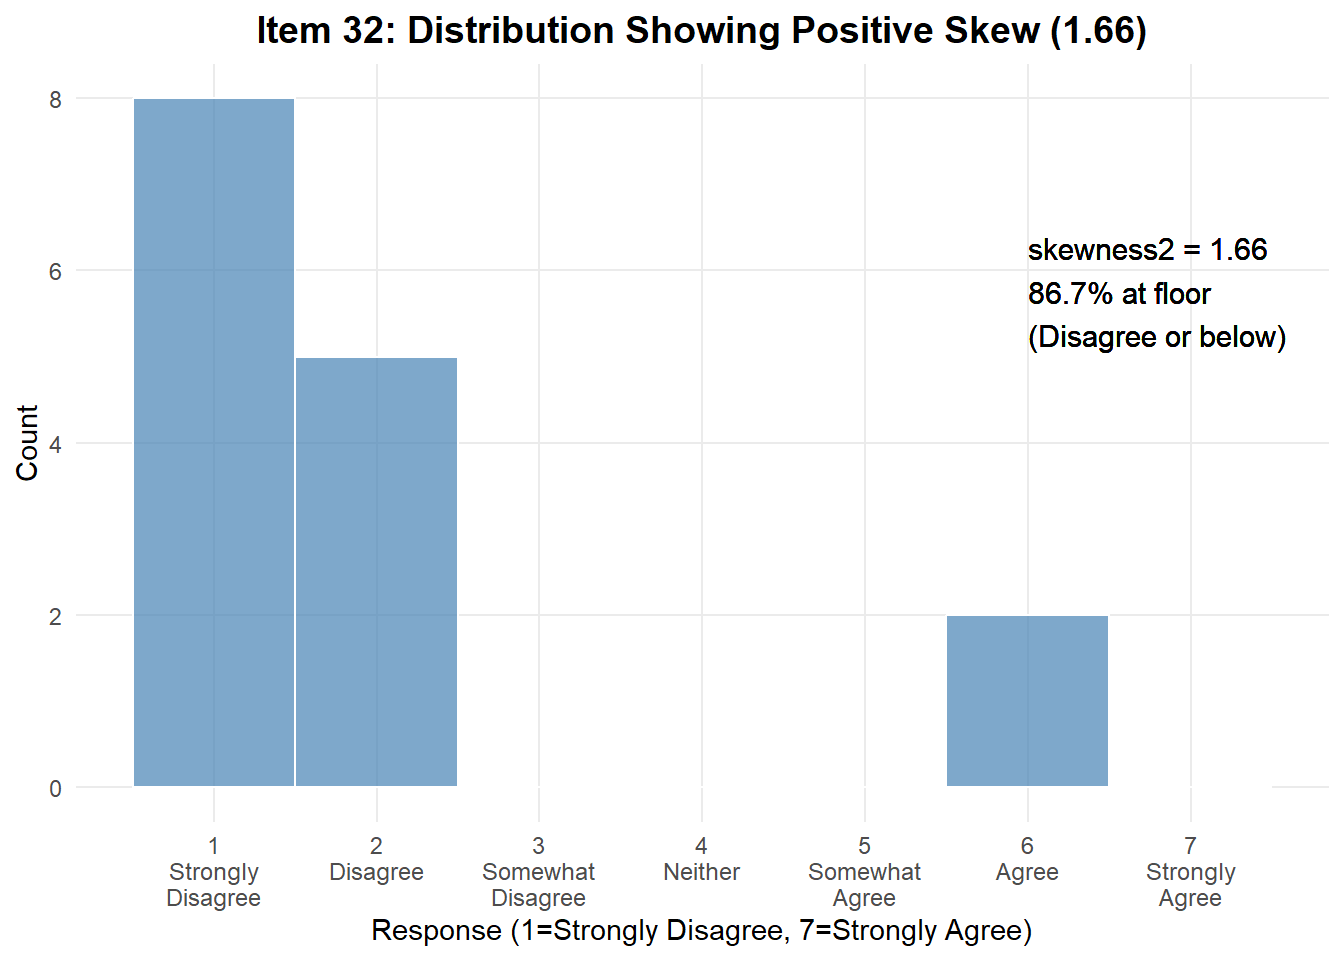
> **Item 32** - I wouldn't use a fitness app because I find technology frustrating.
::: {.cell}
:::
::: {.cell}
::: {.cell-output-display}
Table: Item 32 Response Distribution
|Response | Response Value | Count| Percentage|
|:-----------------|:--------------:|-----:|----------:|
|Strongly disagree | 1 | 8| 53.3|
|Disagree | 2 | 5| 33.3|
|Agree | 6 | 2| 13.3|
:::
:::
# Histogram visualisation
#### Visual Distribution Analysis for Critical and High Severity Items
::: {.cell}
:::
#### Visual Distribution Analysis for Critical and High Severity Items
::: {.cell}
:::
#### Response Count Verification Tables
::: {.cell}
:::
#### Summary of Distribution Patterns
::: {.cell}
:::
::: {.cell}
::: {.cell-output-display}
{width=672}
:::
:::
#### Interpretation
Item 32 is **highly positively skewed**, with the vast majority of responses clustering at the **low** end. In total, **85.7%** of participants disagreed with the statement, creating a floor effect. This suggests **strong disagreement** with the statement. If repeated in the wider study, this item would have **poor discriminant validity** at the individual level, along this construct.
------------------------------------------------------------------------
## Inter-Item Relationships
::: {.cell}
:::
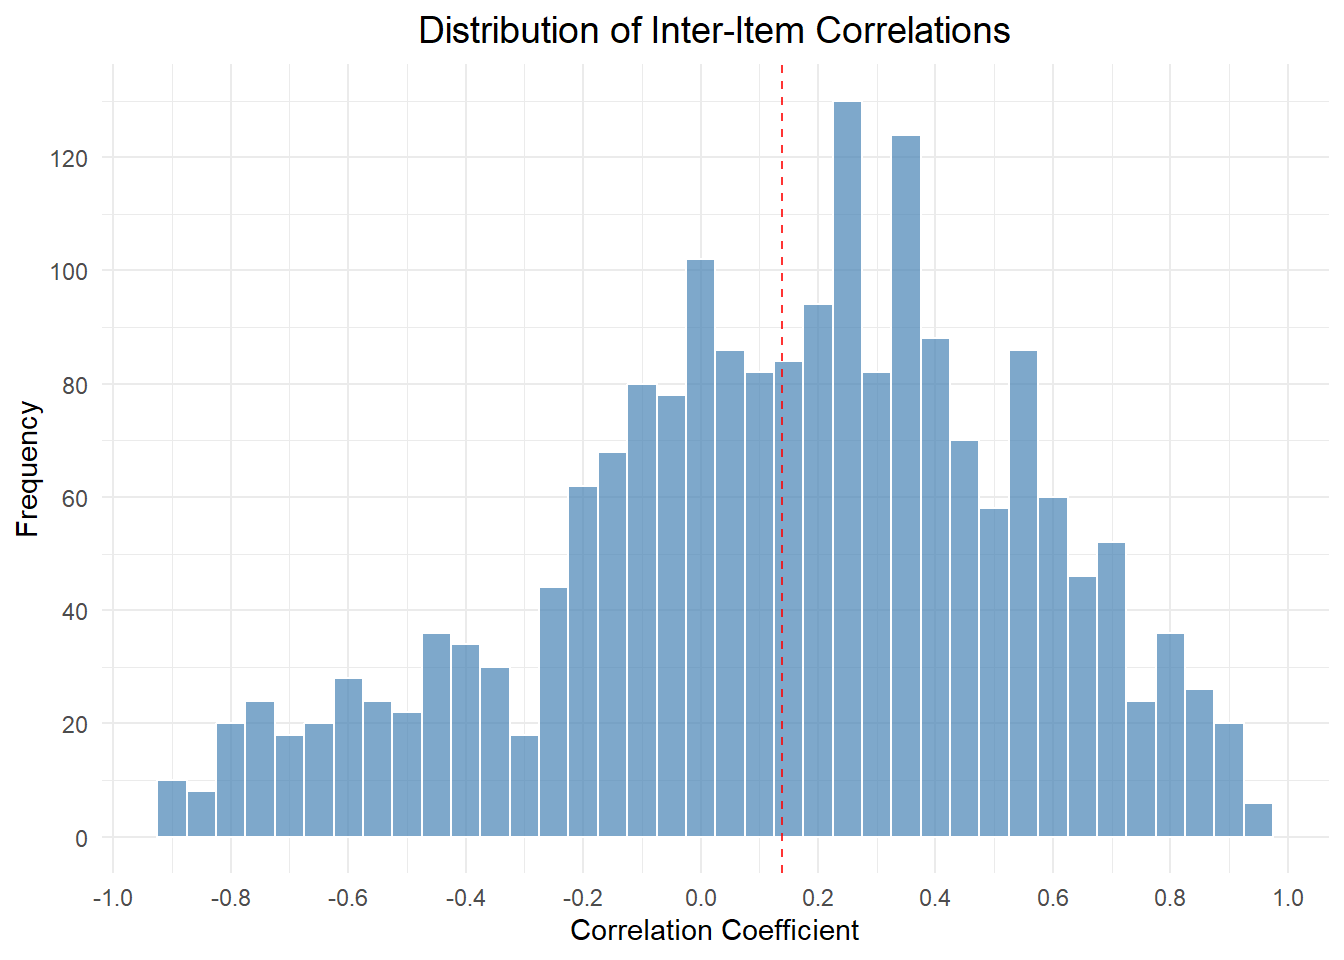
#### Inter-item correlation analysis
::: {.cell}
::: {.cell-output .cell-output-stdout}Total survey items (excluding attention checks): 45
:::
:::


#### Correlation summary statistics


::: {.cell}
::: {.cell-output-display}
|Statistic           |  Value|
|:-------------------|------:|
|Mean Correlation    |  0.138|
|Median Correlation  |  0.183|
|Standard Deviation  |  0.400|
|Minimum Correlation | -0.917|
|Maximum Correlation |  0.940|
|25th Percentile     | -0.099|
|75th Percentile     |  0.419|
:::
:::


#### Problematic correlations

**Highly correlated items** (r\> .85-.90) can create statistical problems of **multicolliniarity** during analysis, making it difficult to interpret regression analysis/structural equation modelling. Further, they may indicate **redundancy and inefficiency** in the scale, by measuring the same construct twice. However, this is less of an issue with a long-form draft scale where the intention is to reduce the number of items following analysis.


::: {.cell}
::: {.cell-output-display}
|Item_1  |Item_2  | Correlation|
|:-------|:-------|-----------:|
|Item_7  |Item_8  |       0.852|
|Item_1  |Item_10 |       0.894|
|Item_7  |Item_10 |       0.885|
|Item_10 |Item_27 |       0.930|
|Item_24 |Item_27 |       0.900|
|Item_24 |Item_30 |      -0.904|
|Item_27 |Item_30 |      -0.870|
|Item_29 |Item_31 |      -0.917|
|Item_29 |Item_33 |      -0.905|
|Item_31 |Item_33 |       0.937|
|Item_33 |Item_38 |       0.853|
|Item_29 |Item_40 |      -0.869|
|Item_39 |Item_40 |       0.862|
|Item_29 |Item_42 |      -0.906|
|Item_31 |Item_42 |       0.889|
|Item_33 |Item_42 |       0.899|
|Item_39 |Item_42 |       0.853|
|Item_40 |Item_42 |       0.940|
|Item_29 |Item_44 |      -0.858|
|Item_40 |Item_44 |       0.880|
|Item_42 |Item_44 |       0.908|
|Item_43 |Item_44 |       0.858|
|Item_29 |Item_45 |      -0.890|
|Item_33 |Item_45 |       0.878|
|Item_40 |Item_45 |       0.880|
|Item_42 |Item_45 |       0.908|
:::
:::


#### Poorly correlated items


::: {.cell}
::: {.cell-output .cell-output-stdout}
No items with maximum correlation < 0.10 found. ``` ::: :::
Correlation distribution
Items within unidimensional scales would be expected to strongly correlated (typically r>.50-.80). However, items within multidimensional scales, where the dimensions are not independent and theoretically related might show weaker correlations (r>.10-.50).
Recommendations for Full Study
Survey Modifications
Items Requiring Revision: - [Item name/number]: [specific issue and suggested revision]
- [Include rationale for each recommended change]
Data Collection Protocols
Participant Screening: - [Any additional screening criteria based on pilot findings]
- [Quality control measures to implement]
Sample Size Considerations: - [Based on preliminary effect sizes and factor structure complexity]
- [Recommendations for achieving adequate power for ESEM]
Integration with Main Dataset
Feasibility Assessment: - Can pilot data be included in main analysis? [Yes/No with justification]
- If yes: [any special considerations for combined analysis]
- If no: [reasons and implications for study timeline/budget]
Appendices
Appendix A: Correlation Matrix
[Include full inter-item correlation matrix]
Report Prepared By: Lee Mercer
Date: 12 August 2025
Version: 0.1