| Statistic | Value |
|---|---|
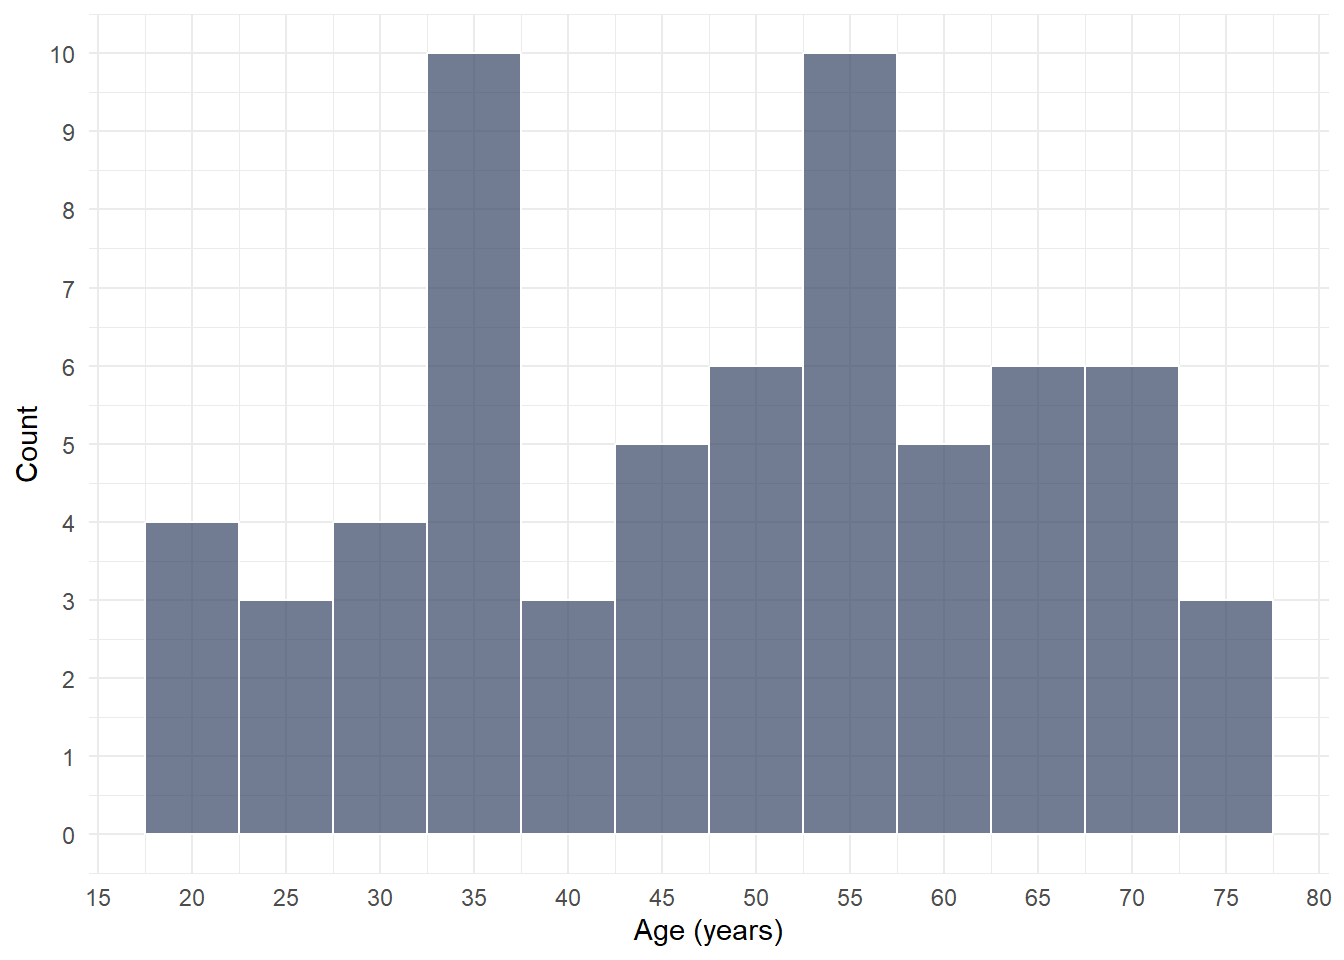
| Mean | 48.5 |
| Standard Deviation | 15.6 |
| Median | 52.0 |
| Minimum | 19.0 |
| Maximum | 77.0 |
Combined
This Report
This report summarises the pilot of the digital health enablement (DHE) measure with 65 participants in July 2025. Its purpose is to evaluate the study methodology and identify areas for improvement before full-scale implementation.
Executive Summary
A pilot survey was conducted in July 2025 to test and refine the survey methodology. The study recruited 65 participants through two channels: 50 participants via the online survey recruitment platform Prolific and an additional convenience sample of 15 friends and family members of the research team who completed paper-copies of the survey. The purpose of the pilot was to evaluate the survey instrument and procedures prior to full-scale implementation.
50 of 52 online participants successfully completed the study. Four attention check questions requiring participants to select specific predetermined answers were embedded throughout the survey and were passed in 99% of cases among online participants, though these questions caused some confusion in paper-based versions, with one participant failing to respond to them.
The online sample comprised 54% males (n = 27) and 46% females (n=23). Efforts to over-represent lower socioeconomic backgrounds were successful, with 58% earning below £28,000 annually and 54% having school-level, vocational, or no formal qualifications. Ethnic composition mirrored the UK population: 88% (n = 45) White British/Northern Irish and 12% (n=6) ethnic minorities.
Date: 27 August 2025
Version: 0.1
2. Sample demographics
Age
Age groups
| Age Group | Count | Percentage |
|---|---|---|
| 16-24 | 5 | 7.7 |
| 25-34 | 8 | 12.3 |
| 35-44 | 13 | 20.0 |
| 45-54 | 16 | 24.6 |
| 55-64 | 11 | 16.9 |
| 65+ | 12 | 18.5 |
Age distribution
Gender
| Gender | Count | Percentage |
|---|---|---|
| Male | 34 | 52.3 |
| Female | 31 | 47.7 |
Education
| Education Level | Count | Percentage |
|---|---|---|
| No Qualifications | 6 | 9.2 |
| School-level (GCSEs, CSEs, O-Levels, or equivalent) | 14 | 21.5 |
| Vocational and technical (NVQ Level 1 and 2, BTEC, Apprenticeships, or equivalent) | 10 | 15.4 |
| Further education (A-Level, NVQ, Scottish Highers, or equivalent) | 7 | 10.8 |
| Higher education (HNC, HND, Foundational Degree, or equivalent) | 3 | 4.6 |
| Undergraduate Degree (BA, BSc, BEng, or equivalent) | 16 | 24.6 |
| Postgraduate and professional (MA, MSc, MBA, PhD, or equivalent) | 9 | 13.8 |
Ethnicity
| Ethnic Group | Count | Percentage |
|---|---|---|
| English/Welsh/Scottish/Northern Irish/British | 58 | 89.2 |
| Any other White Background | 2 | 3.1 |
| Indian | 2 | 3.1 |
| Chinese | 1 | 1.5 |
| White and Black African | 1 | 1.5 |
| White and Black Caribbean | 1 | 1.5 |
Income
| Income Level | Count | Percentage |
|---|---|---|
| Less than £19,000 a year | 21 | 32.3 |
| £19,001 to £28,000 | 15 | 23.1 |
| £28,001 to £38,000 | 12 | 18.5 |
| £38,000 to £55,000 | 6 | 9.2 |
| More than £55,000 a year | 11 | 16.9 |
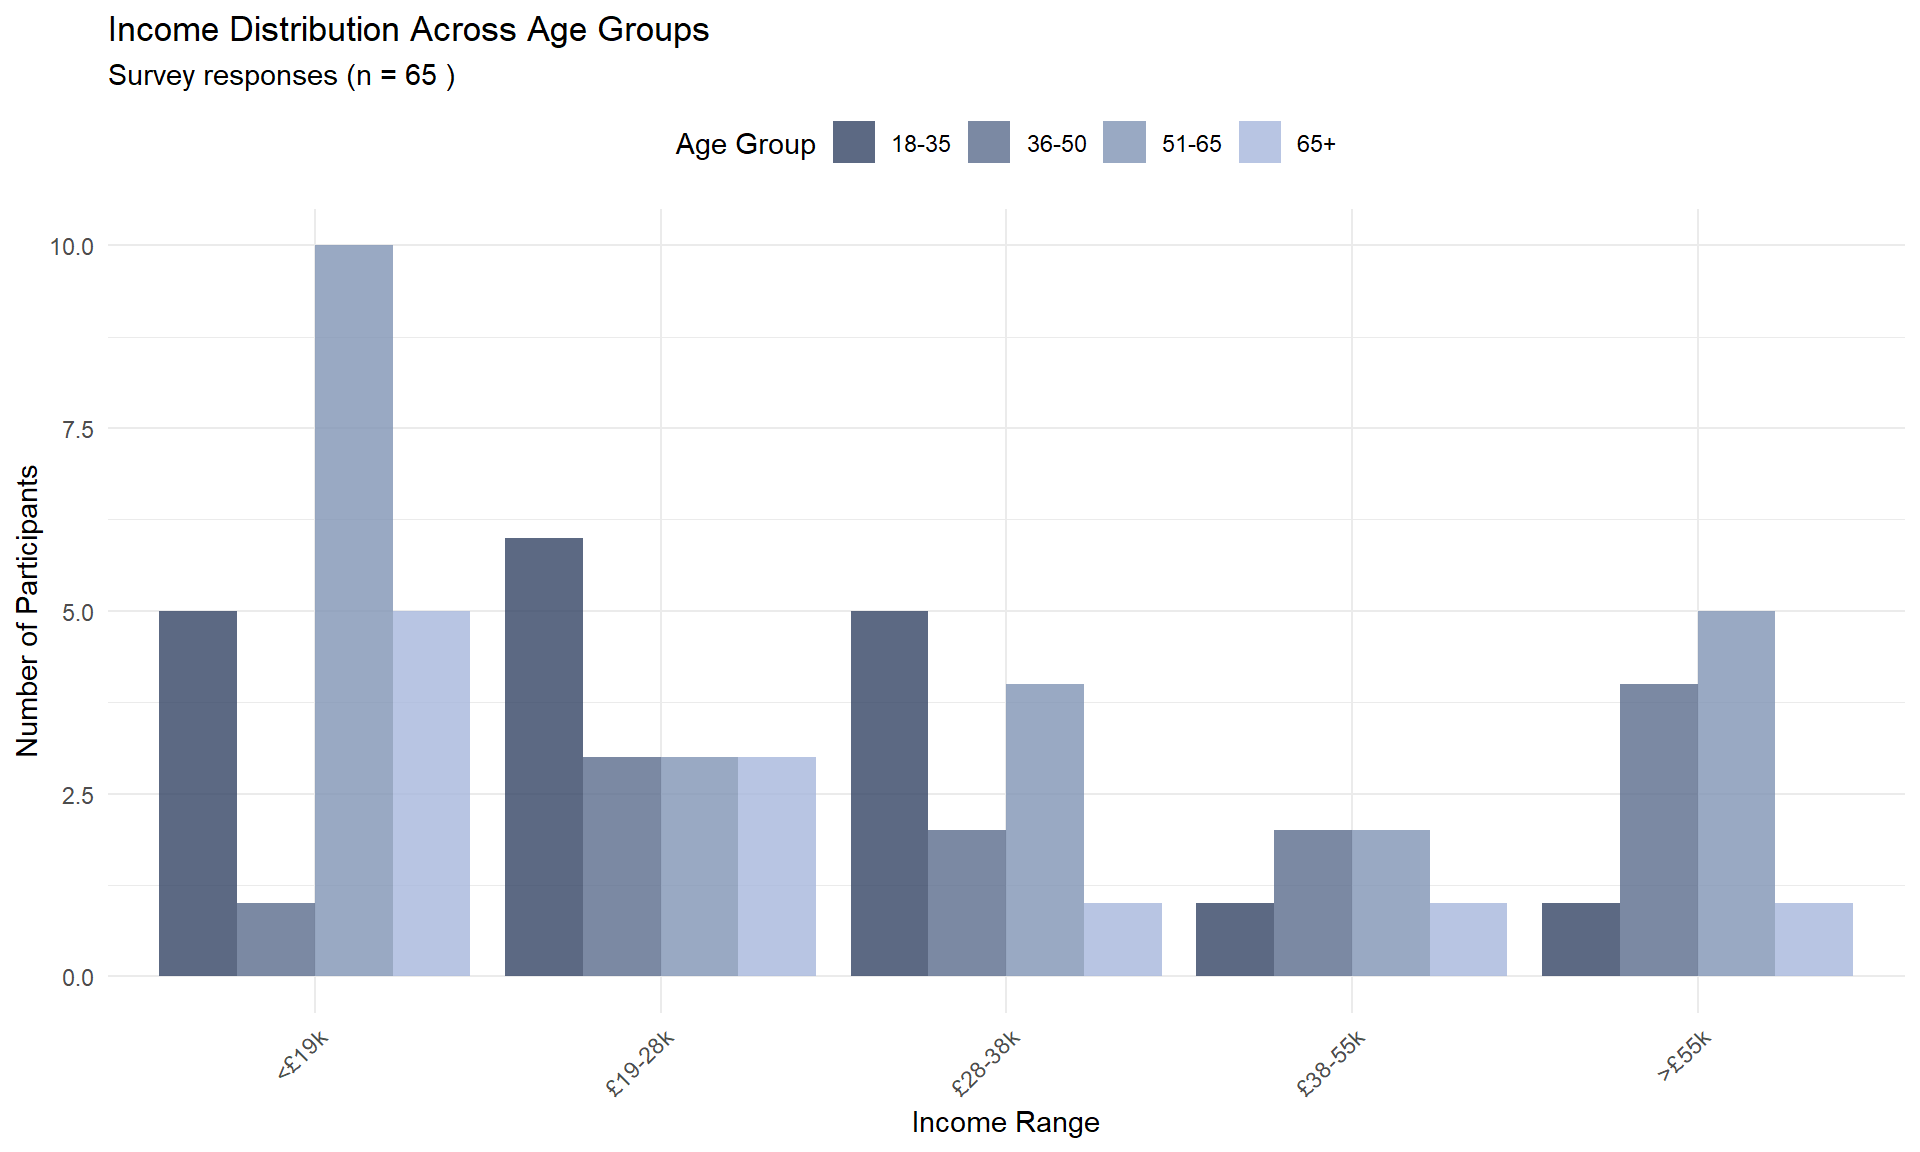
Socioeconomic Status Analysis
Comparative Income Distribution
Education-Income Matrix
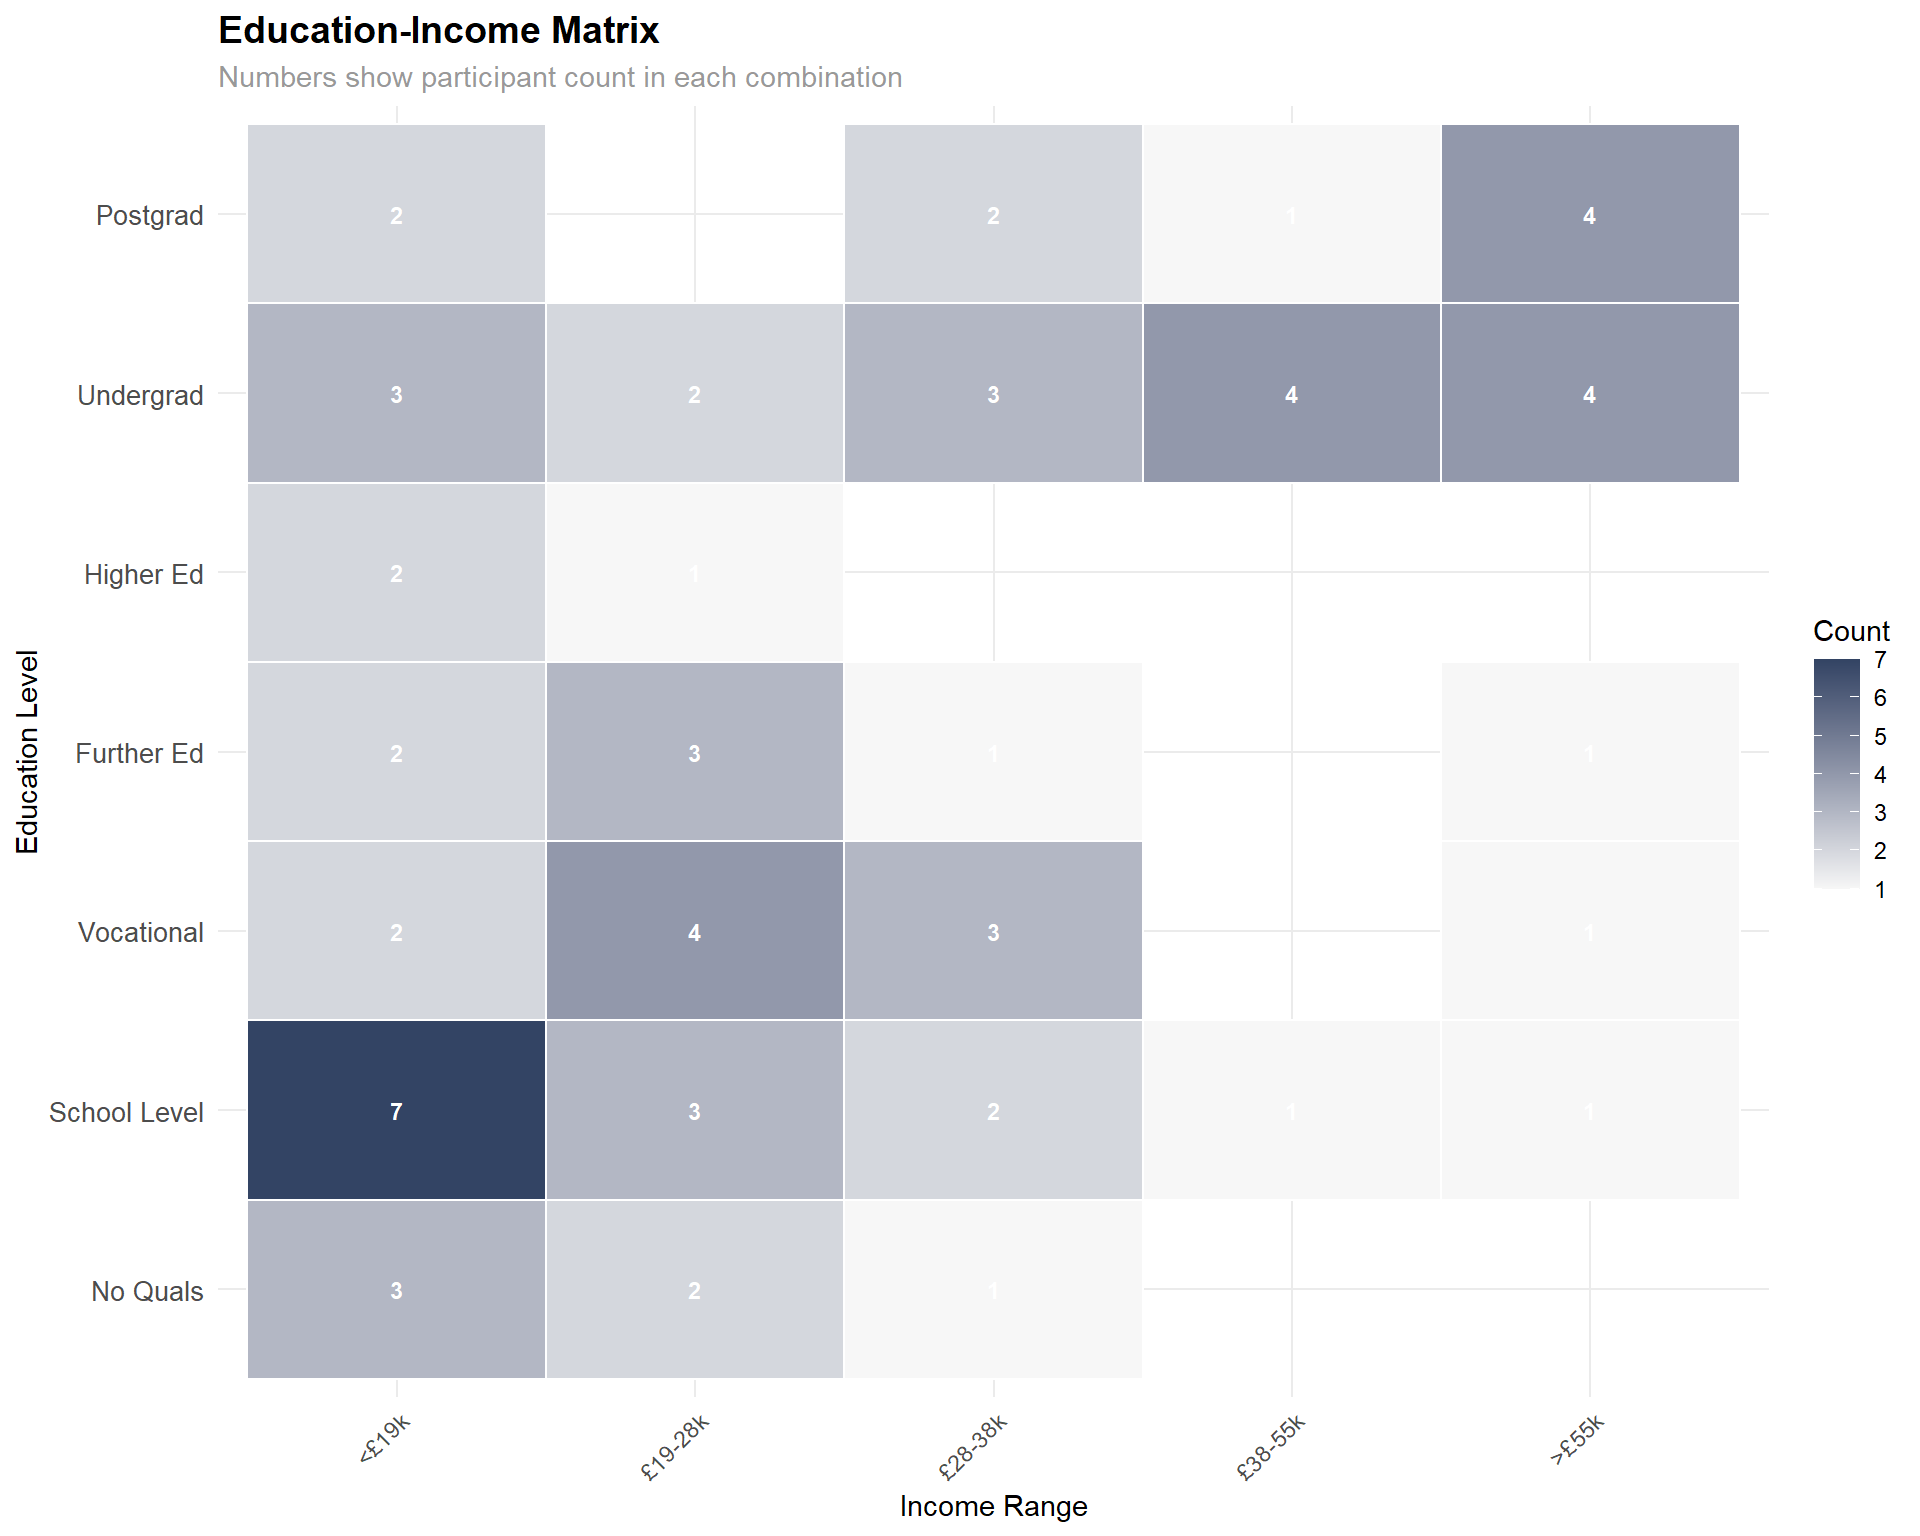
=== EDUCATION-INCOME MATRIX INSIGHTS ===High education + low income participants: 7 out of 36 low income ( 19.4 %)✓ Limited high education-low income pattern
Most common education-income combinations:1 . School Level + <£19k : 7 participants
2 . Vocational + £19-28k : 4 participants
3 . Undergrad + £38-55k : 4 participants
4 . Undergrad + >£55k : 4 participants
5 . Postgrad + >£55k : 4 participants 3. Item-Level Analysis
Items with ‘Critical’ and ‘High’ Concerns
Whilst there are no specific thresholds for skewness or kurtosis in the literature, skewed distributions limit the ability of a measure to discriminate between individuals, and impact upon correlation analysis (DeVellis and Thorpe, 2021). Ceilings or floors of less than 20% are generally acceptable and the skew should ideally be no greater than -2 or +2.
The items listed in the table below demonstrate problematic response distributions, typically characterized by severe skewness (|skew| > 2), floor or ceiling effects (>40% of responses at scale endpoints), and restricted variance that limits their discriminative capacity.
Definitions
- Floor effect - When a large percentage of participants select the minimum response option (e.g., “Strongly Disagree”).
- Ceiling effect - When a large percentage of participants select the maximum response option (e.g., “Strongly Agree”).
- Skewness - A measure of the asymmetry of the response distribution. Values between -1 and +1 are generally acceptable, while values beyond ±2 indicate severe skewness.
- Kurtosis - How much probability mass is concentrated in the tails of a distribution compared to a normal distribution.
While the pilot study’s sample size (n = 50) necessitates cautious interpretation, identifying problematic items at the pilot stage, present an opportunity improve these items items before full-scale implementation.
In total, eleven items (22% of the substantive survey content) met the criteria for high severity or critical classification according to the psychometric thresholds detailed below.
Crtieria
| Issue | Critical | High | Moderate | Mild |
|---|---|---|---|---|
| Skewness | |skew| > 6 | |skew| > 2 | 1 < |skew| ≤ 2 | 1 < |skew| ≤ 1.5 |
| Floor Effect | 100% of responses at minimum | >40% at minimum | 20-40% at minimum | 15-20% at minimum |
| Ceiling Effect | 100% of responses at maximum | >40% at maximum | 20-40% at maximum | 15-20% at maximum |
| Variance (SD) | SD = 0 | SD < 0.70 | 0.70 ≤ SD < 1.0 | 0.90 ≤ SD < 1.0 |
| Kurtosis | |kurt| > 10 | |kurt| > 4 | 3 < |kurt| ≤ 4 | 2 < |kurt| ≤ 3 |
| Response Categories | Only 1-2 categories used | Only 3 categories used | Only 4 categories used | Only 5 categories used |
| Classification Logic | If any critical condition is met | If any high condition is met OR ≥3 moderate conditions | If any moderate condition is met OR ≥2 mild conditions | If any mild condition is met |
Table of items exhibiting ‘critical’ or ‘high’ concerns
| Item | Item Wording | Severity | Mean | SD | Skewness | Kurtosis | Floor % | Ceiling % | Issues |
|---|---|---|---|---|---|---|---|---|---|
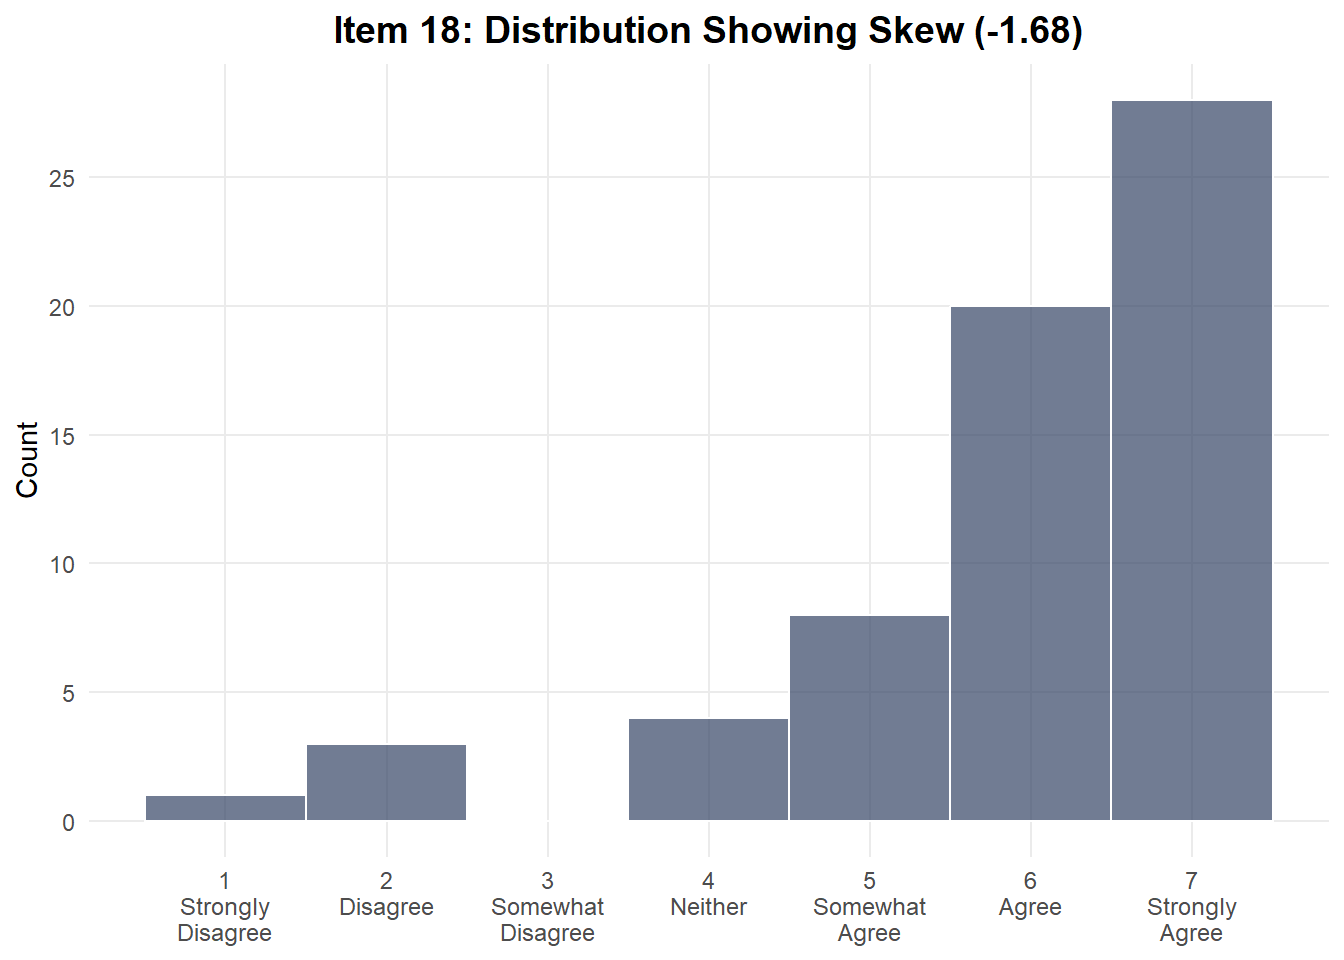
| Item_18 | I would expect health technologies to have measures in place… | High | 5.922 | 1.406 | -1.684 | 2.571 | 1.6 | 43.8 | moderate negative skew; extreme ceiling effect |
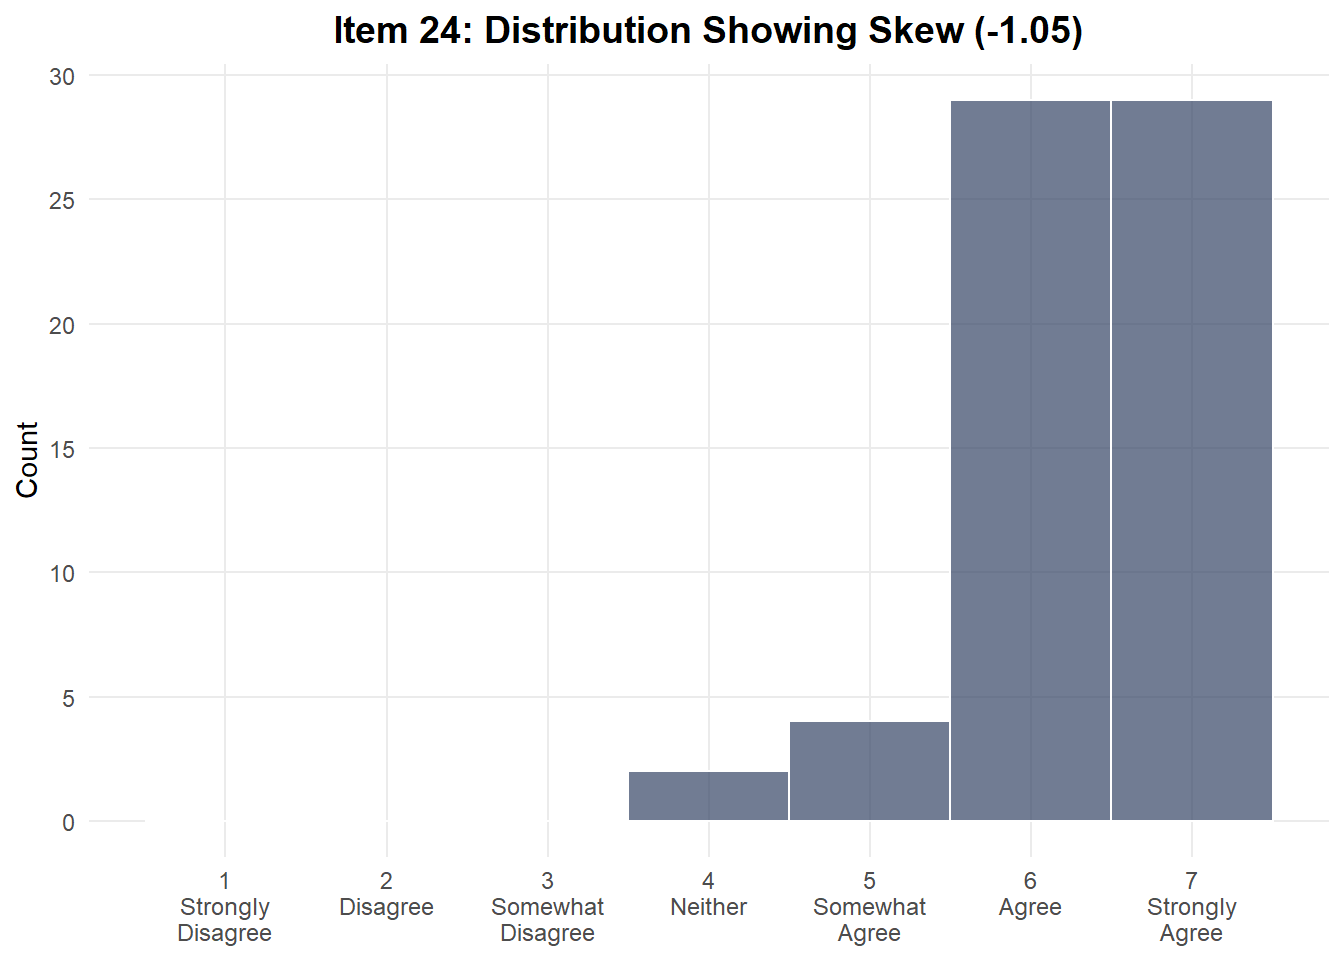
| Item_24 | I am confident I could learn how to use a fitness app if I w… | High | 6.328 | 0.736 | -1.053 | 1.128 | 3.1 | 45.3 | moderate negative skew; extreme ceiling effect; low variance |
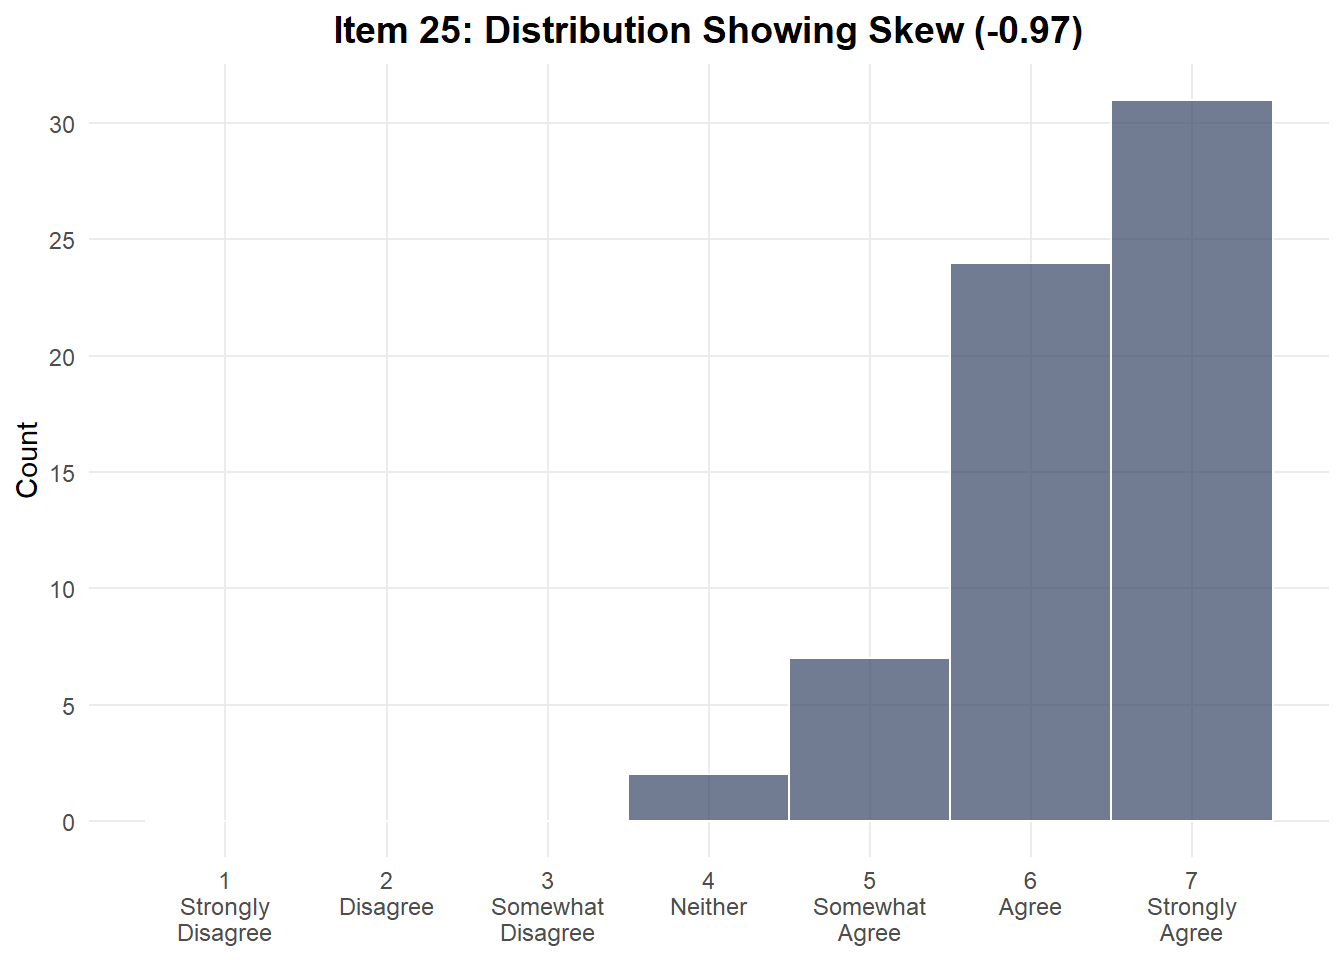
| Item_25 | I am confident I could use a fitness app to monitor my healt… | High | 6.312 | 0.794 | -0.973 | 0.341 | 3.1 | 48.4 | extreme ceiling effect; low variance |
| Item_27 | I am confident I could use a fitness app without help if I w… | High | 6.109 | 1.223 | -2.306 | 6.067 | 1.6 | 43.8 | severe negative skew; extreme ceiling effect; high positive kurtosis |
| Item_28 | I am confident I could troubleshoot basic issues with a fitn… | High | 5.578 | 1.193 | -2.034 | 5.455 | 3.1 | 14.1 | severe negative skew; high positive kurtosis |
| Item_32 | I wouldn’t use a a fitness app because I find technology fru… | High | 2.000 | 1.480 | 2.140 | 3.936 | 43.8 | 3.1 | severe positive skew; extreme floor effect; high positive kurtosis |
| Item_6 | I can usually download apps. | High | 6.594 | 0.660 | -1.646 | 2.593 | 1.6 | 67.2 | moderate negative skew; extreme ceiling effect; very low variance |
| Item_7 | I can usually use digital technology. | High | 6.125 | 1.062 | -1.890 | 4.747 | 3.1 | 42.2 | moderate negative skew; extreme ceiling effect; high positive kurtosis |
| Item_8 | I can troubleshoot basic issues with digital technology. | High | 5.734 | 1.102 | -1.505 | 3.821 | 1.6 | 21.9 | moderate negative skew; ceiling effect; high positive kurtosis |
Revise wording to items?
One option to address problematic items is to modify items to avoid extreme language that pushes responses toward scale endpoints. For example, Item 9 - “I often struggle to use digital technology” could be revised to “I find it easy to adapt when digital technology updates or changes” which would allow more meaningful discrimination between respondents’ capabilities.
Suggestions for wording revisions are set out in the item-level summaries which follow.
4. Individual item analysis
Item 1 - “I would understand what a health technology was asking me to do to improve my health”
| Response | Response Value | Count | Percentage |
|---|---|---|---|
| Somewhat disagree | 3 | 1 | 1.6 |
| Neither agree nor disagree | 4 | 1 | 1.6 |
| Somewhat agree | 5 | 11 | 17.2 |
| Agree | 6 | 32 | 50.0 |
| Strongly agree | 7 | 19 | 29.7 |
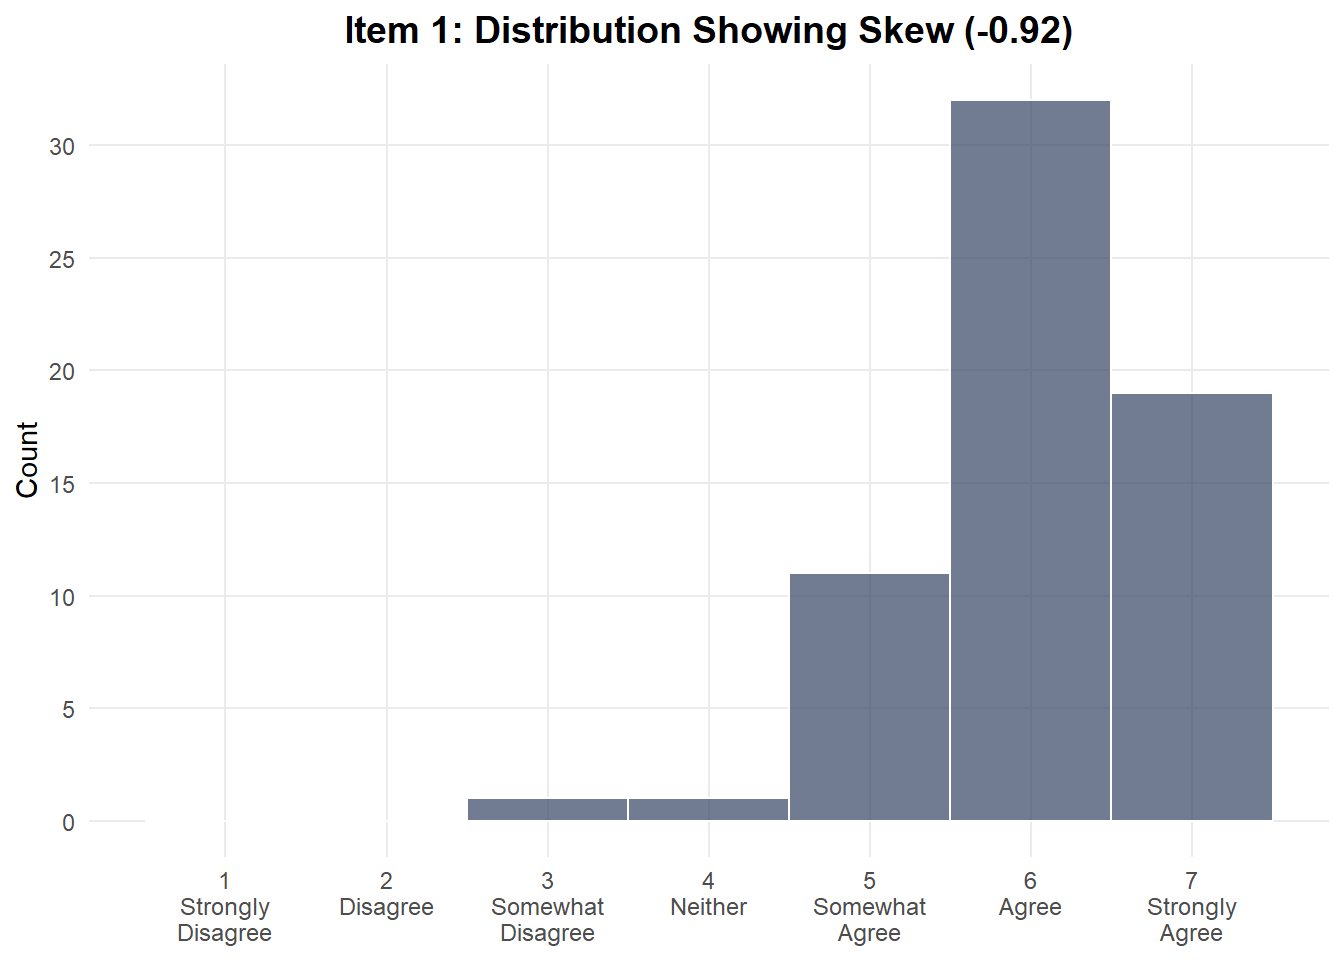
Suggested Revision
“I would understand detailed health recommendations from technology”
Item 18 - “I would expect health technologies to have measures in place to keep my information safe”
| Response | Response Value | Count | Percentage |
|---|---|---|---|
| Strongly disagree | 1 | 1 | 1.6 |
| Disagree | 2 | 3 | 4.7 |
| Neither agree nor disagree | 4 | 4 | 6.2 |
| Somewhat agree | 5 | 8 | 12.5 |
| Agree | 6 | 20 | 31.2 |
| Strongly agree | 7 | 28 | 43.8 |
Suggested Revision
“I don’t have concerns about the security of my personal data when using health technology”
Item 24 - “I am confident I could learn how to use a fitness app if I wanted to”
| Response | Response Value | Count | Percentage |
|---|---|---|---|
| Neither agree nor disagree | 4 | 2 | 3.1 |
| Somewhat agree | 5 | 4 | 6.2 |
| Agree | 6 | 29 | 45.3 |
| Strongly agree | 7 | 29 | 45.3 |
Suggested Revision
“I am confident I could quickly learn how to use a fitness app if I wanted to”
Item 25 - “I am confident I could use a fitness app to monitor my health if I wanted to”
| Response | Response Value | Count | Percentage |
|---|---|---|---|
| Neither agree nor disagree | 4 | 2 | 3.1 |
| Somewhat agree | 5 | 7 | 10.9 |
| Agree | 6 | 24 | 37.5 |
| Strongly agree | 7 | 31 | 48.4 |
Suggested Revision
“I am confident I could get the most of the health monitoring features in a fitness app if I wanted to”
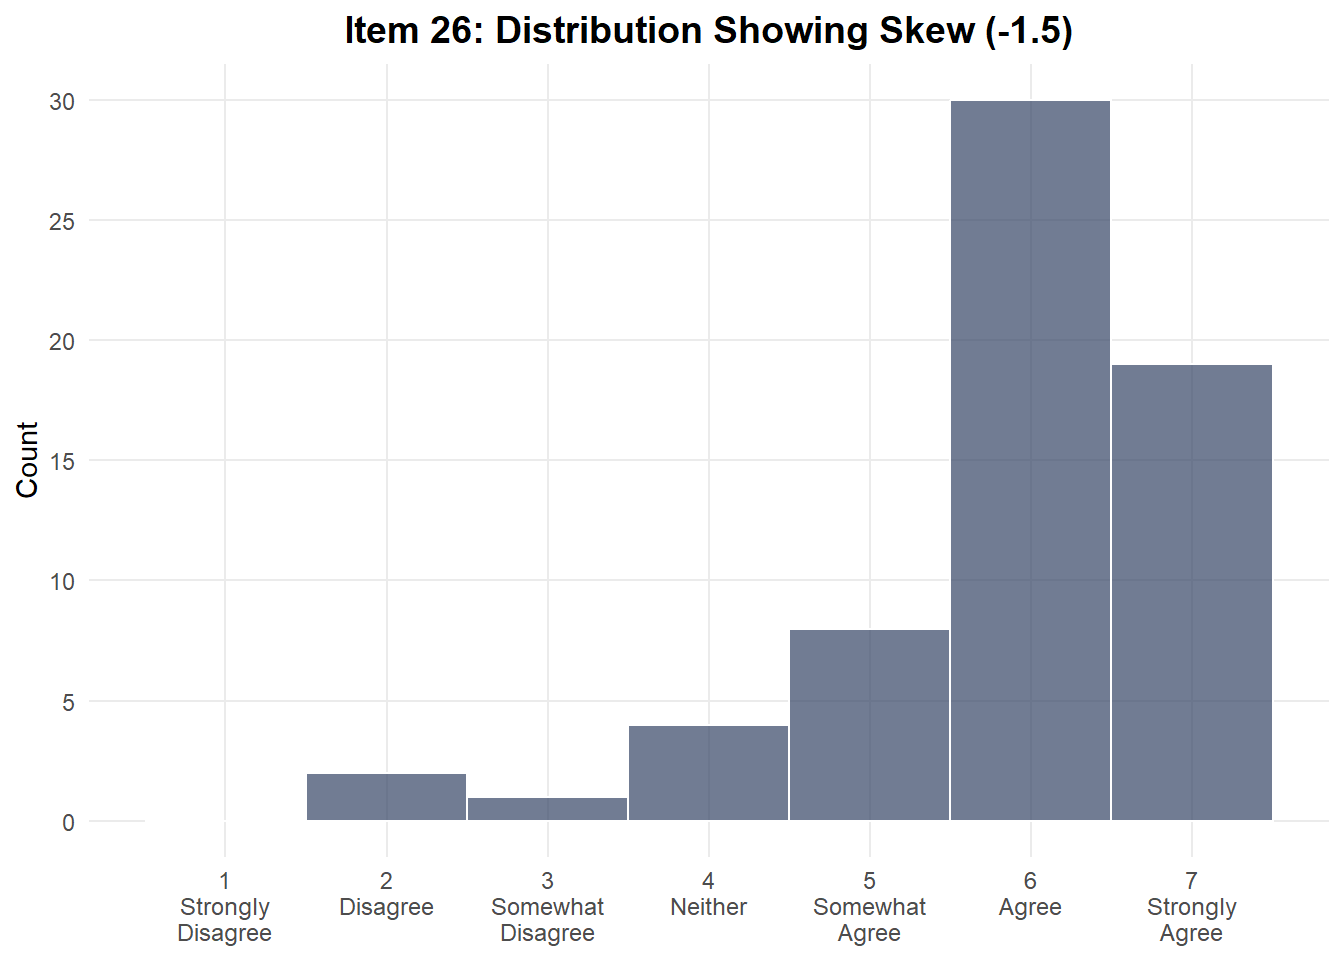
Item 26 - “I am confident I could use a fitness app regularly if I wanted to”
| Response | Response Value | Count | Percentage |
|---|---|---|---|
| Disagree | 2 | 2 | 3.1 |
| Somewhat disagree | 3 | 1 | 1.6 |
| Neither agree nor disagree | 4 | 4 | 6.2 |
| Somewhat agree | 5 | 8 | 12.5 |
| Agree | 6 | 30 | 46.9 |
| Strongly agree | 7 | 19 | 29.7 |
Suggested Revision
“I am confident I could remember to use a fitness app every day if I wanted to”
Item 27 - “I am confident I could use a fitness app without help if I wanted to”
| Response | Response Value | Count | Percentage |
|---|---|---|---|
| Strongly disagree | 1 | 1 | 1.6 |
| Disagree | 2 | 2 | 3.1 |
| Neither agree nor disagree | 4 | 1 | 1.6 |
| Somewhat agree | 5 | 6 | 9.4 |
| Agree | 6 | 26 | 40.6 |
| Strongly agree | 7 | 28 | 43.8 |
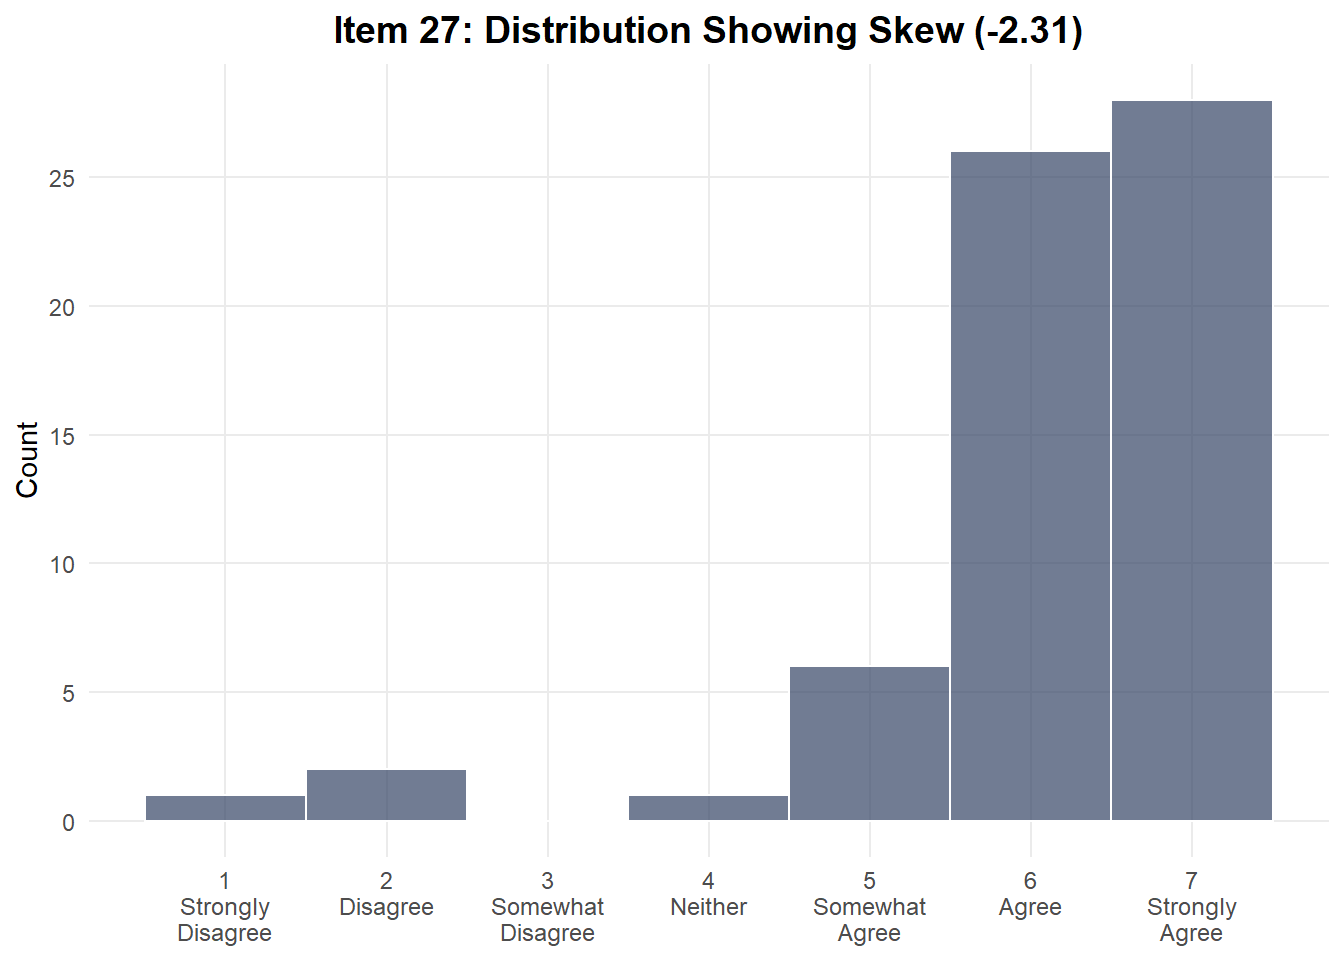
Suggested Revision
“I am confident I could master a fitness app without help if I wanted to”
Item 32 - “I wouldn’t use a fitness app because I find technology frustrating”
| Response | Response Value | Count | Percentage |
|---|---|---|---|
| Strongly disagree | 1 | 28 | 43.8 |
| Disagree | 2 | 27 | 42.2 |
| Somewhat disagree | 3 | 3 | 4.7 |
| Somewhat agree | 5 | 1 | 1.6 |
| Agree | 6 | 3 | 4.7 |
| Strongly agree | 7 | 2 | 3.1 |
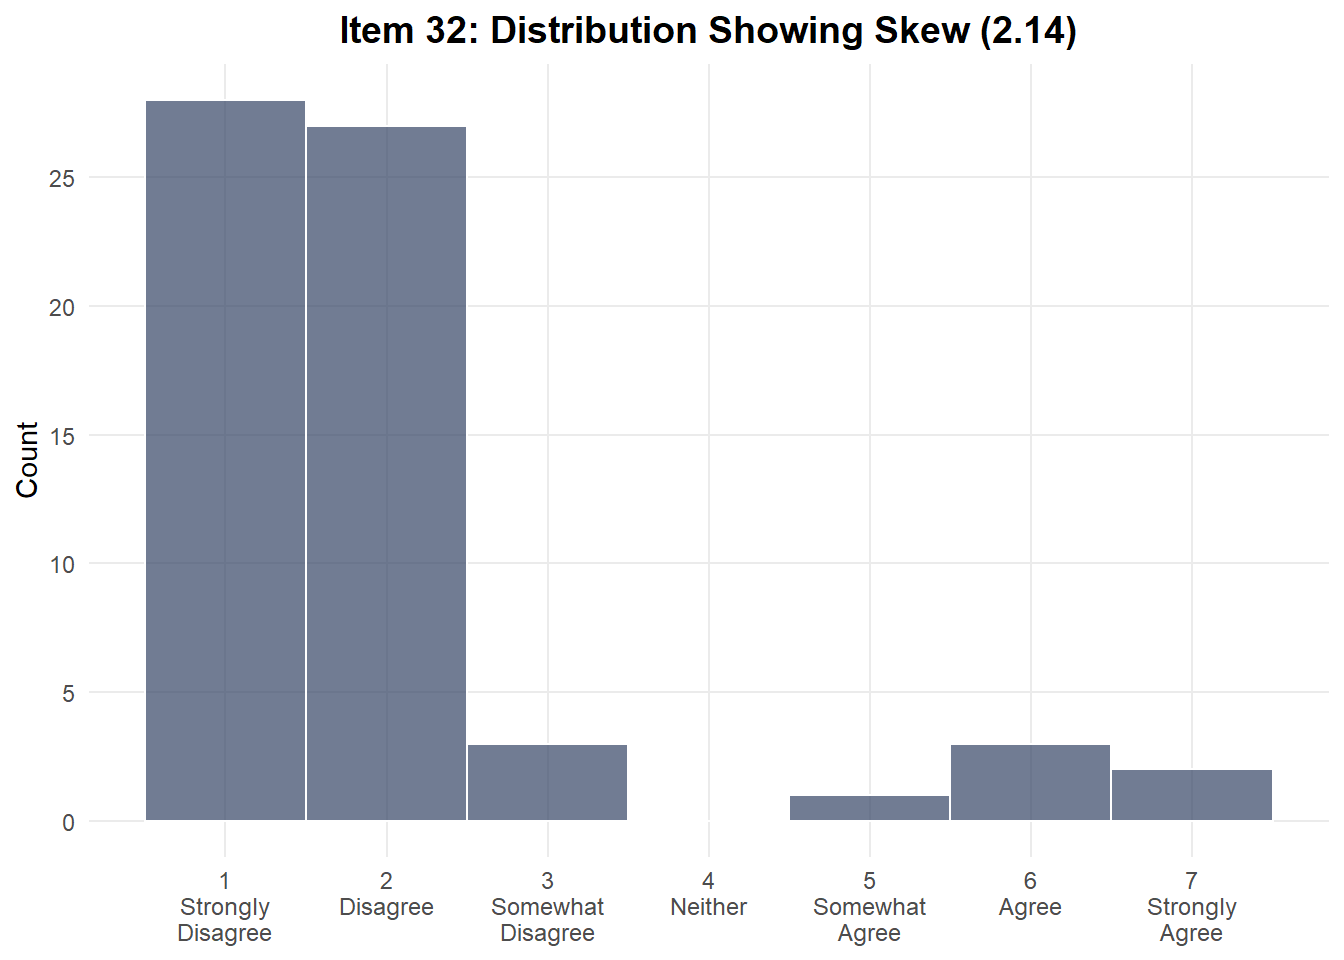
Suggested Revision
“I wouldn’t want to try a new fitness app because I can find technology frustrating”.
Item 4 - “I would understand information about my health from health technology”
| Response | Response Value | Count | Percentage |
|---|---|---|---|
| Disagree | 2 | 1 | 1.6 |
| Neither agree nor disagree | 4 | 4 | 6.2 |
| Somewhat agree | 5 | 17 | 26.6 |
| Agree | 6 | 29 | 45.3 |
| Strongly agree | 7 | 13 | 20.3 |
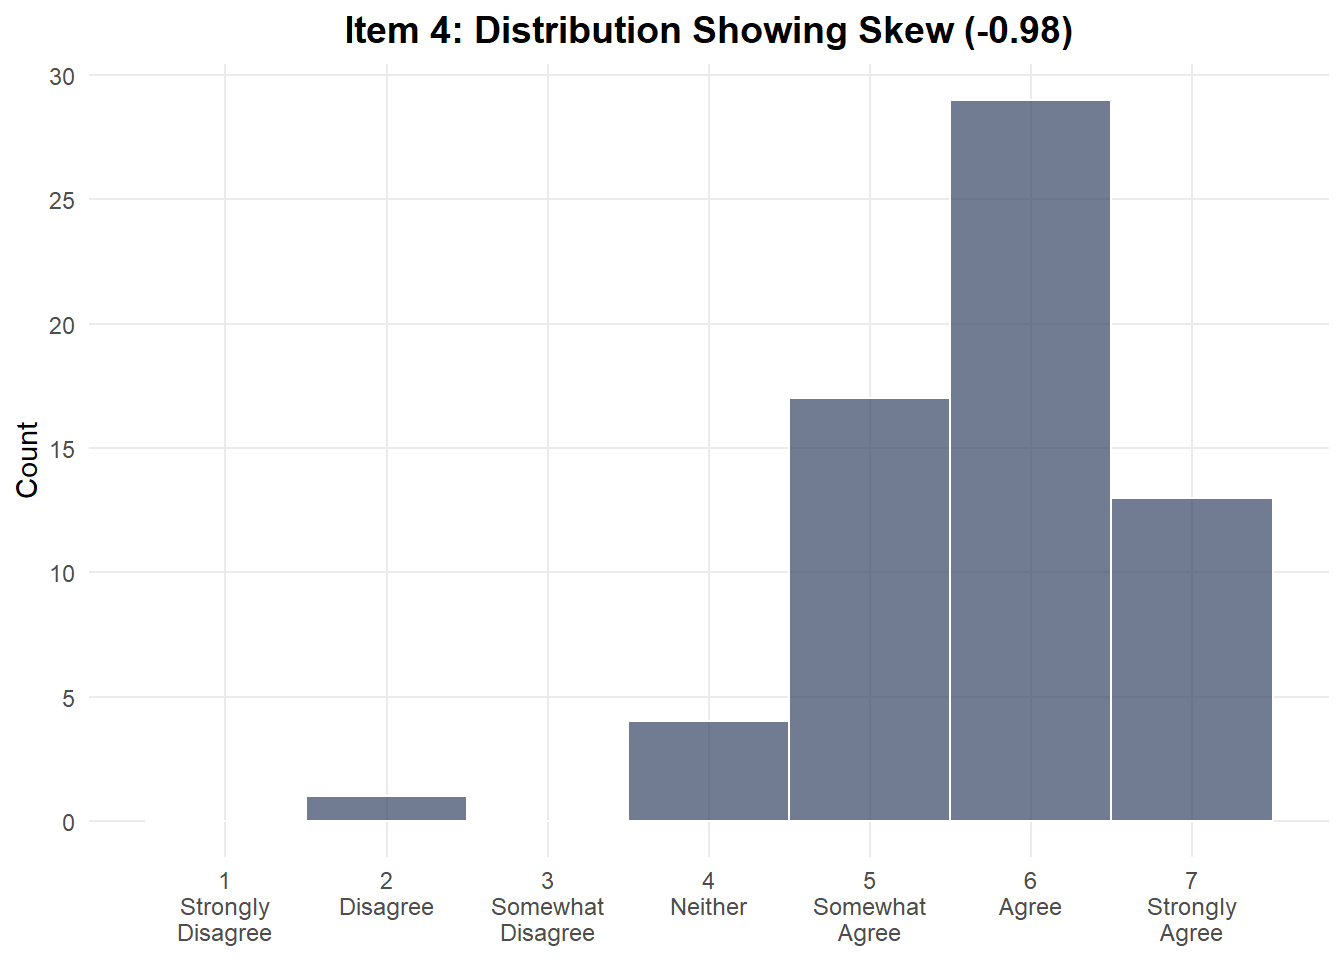
Suggested Revision
“I would understand detailed reports about my health from health technology”
Item 6 - “I can usually download apps”
| Response | Response Value | Count | Percentage |
|---|---|---|---|
| Neither agree nor disagree | 4 | 1 | 1.6 |
| Somewhat agree | 5 | 3 | 4.7 |
| Agree | 6 | 17 | 26.6 |
| Strongly agree | 7 | 43 | 67.2 |
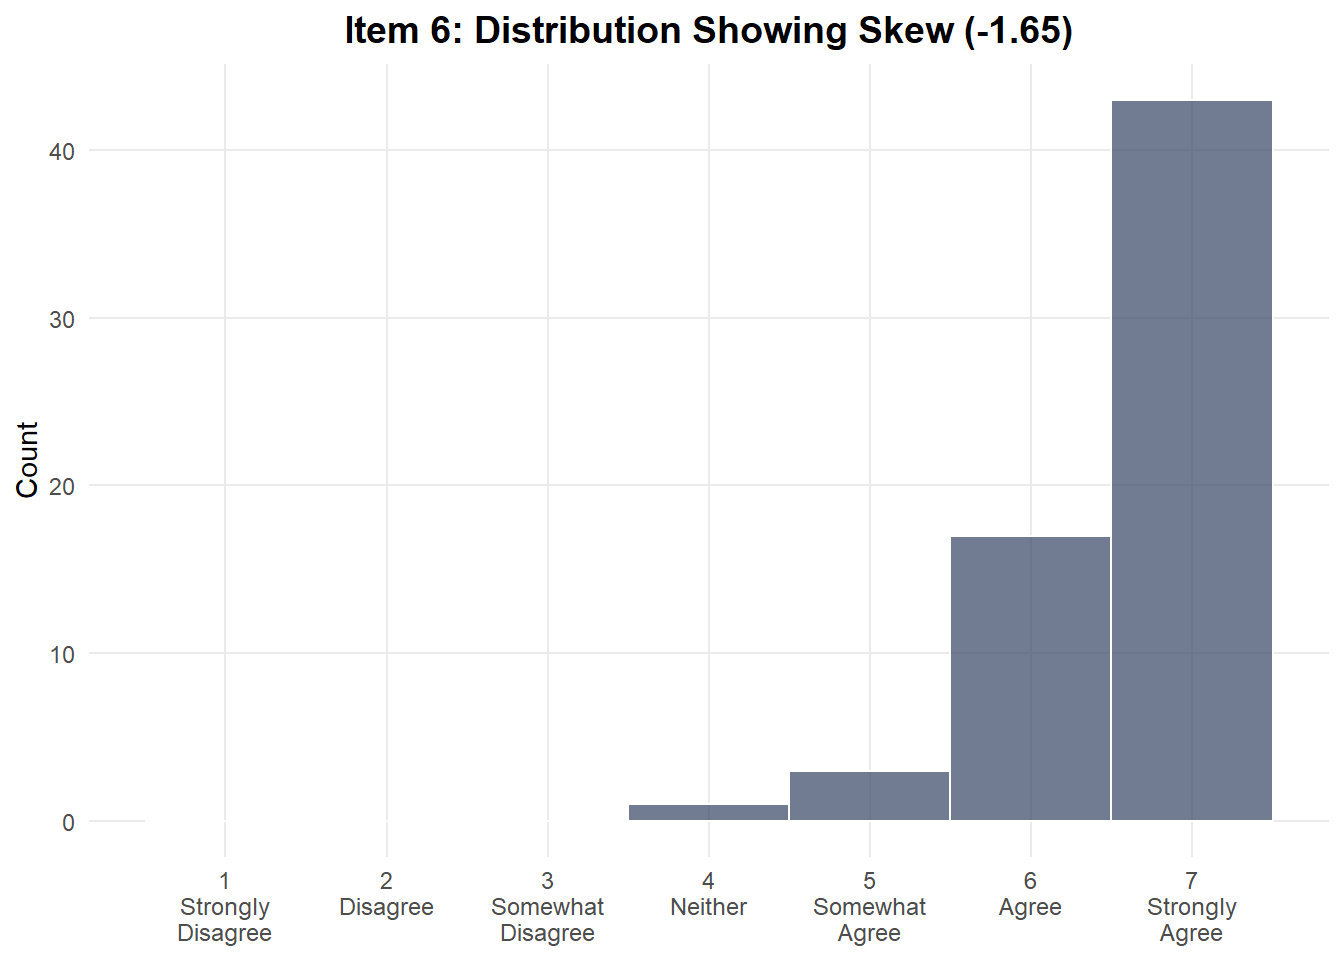
Suggested Revision
“I hardly ever run into difficulties when downloading apps”
Item 7 - “I can usually use digital technology”
| Response | Response Value | Count | Percentage |
|---|---|---|---|
| Disagree | 2 | 2 | 3.1 |
| Neither agree nor disagree | 4 | 1 | 1.6 |
| Somewhat agree | 5 | 9 | 14.1 |
| Agree | 6 | 25 | 39.1 |
| Strongly agree | 7 | 27 | 42.2 |
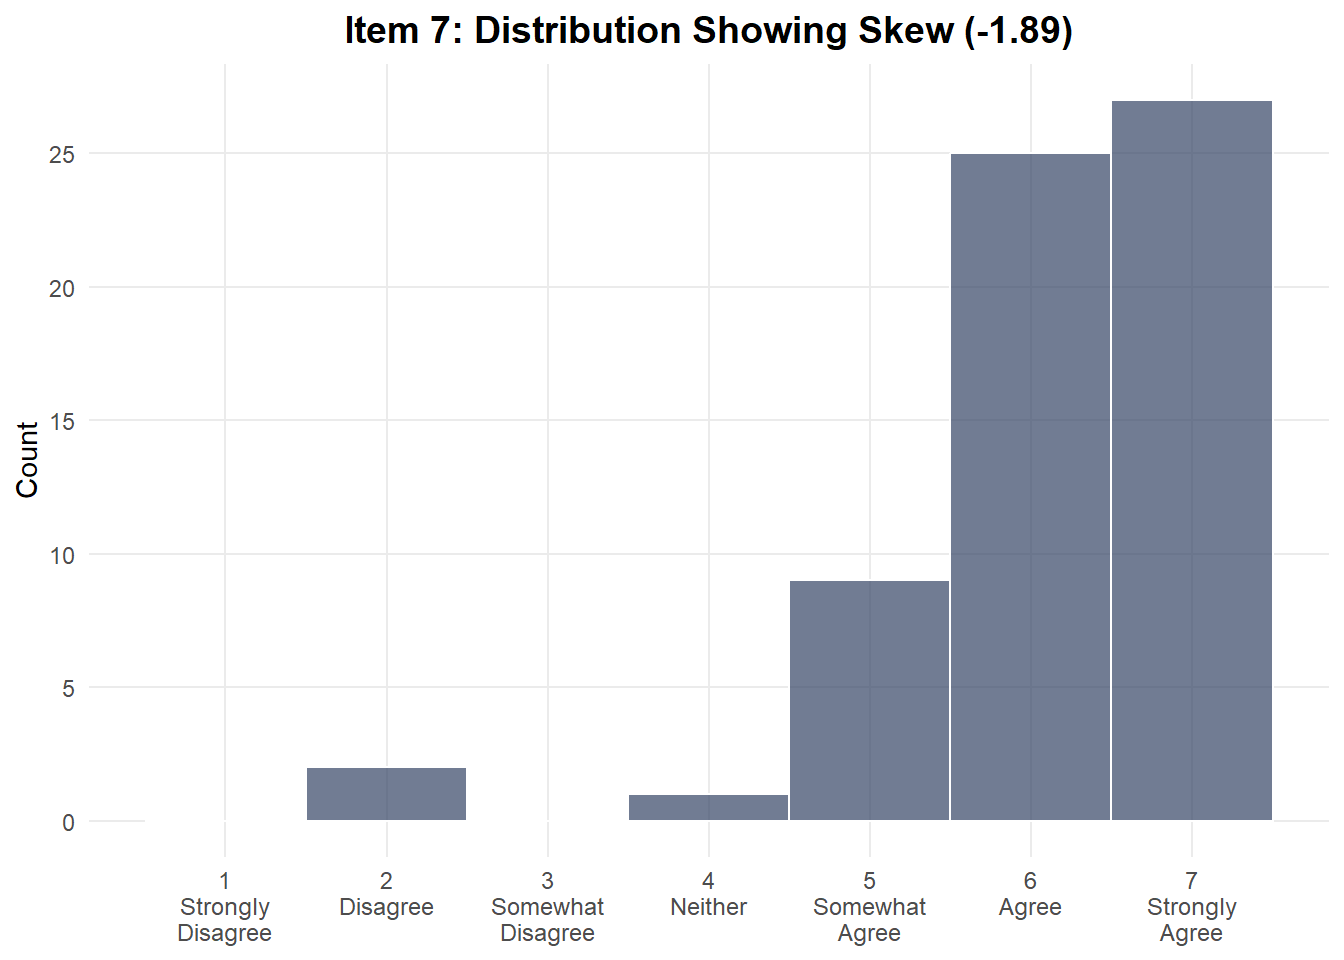
Suggested Revision
Item 7 - “I can use most forms digital technology without difficulty”
Item 9 - “I often struggle to use digital technology”
| Response | Response Value | Count | Percentage |
|---|---|---|---|
| Strongly disagree | 1 | 21 | 32.8 |
| Disagree | 2 | 27 | 42.2 |
| Somewhat disagree | 3 | 5 | 7.8 |
| Neither agree nor disagree | 4 | 3 | 4.7 |
| Somewhat agree | 5 | 5 | 7.8 |
| Agree | 6 | 1 | 1.6 |
| Strongly agree | 7 | 2 | 3.1 |
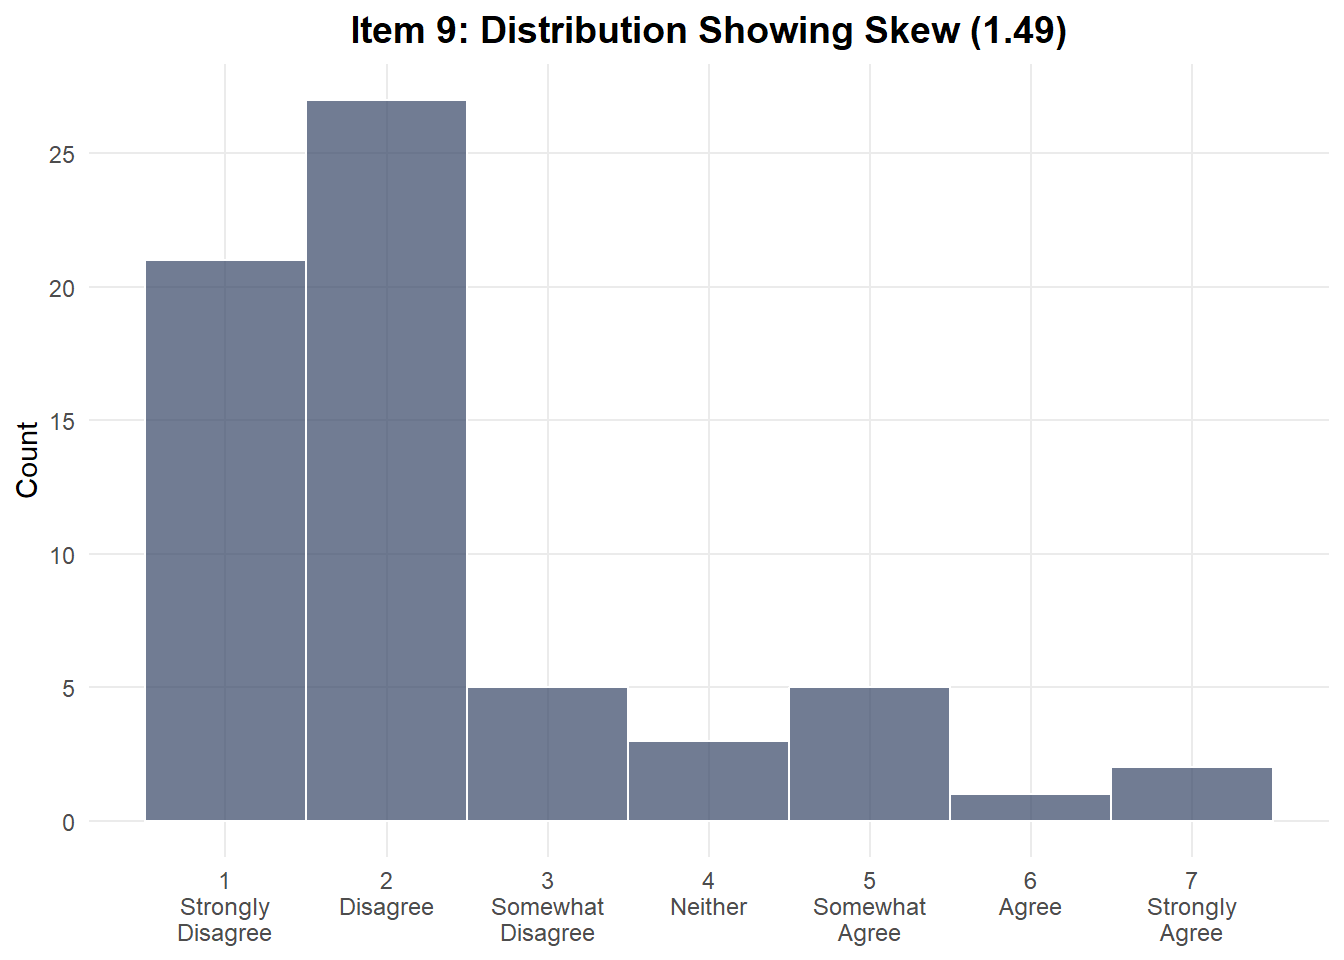
Suggested Revision
Item 9 - “I find it easy to adapt when digital technology updates or changes”.
5. Inter-Item Relationships
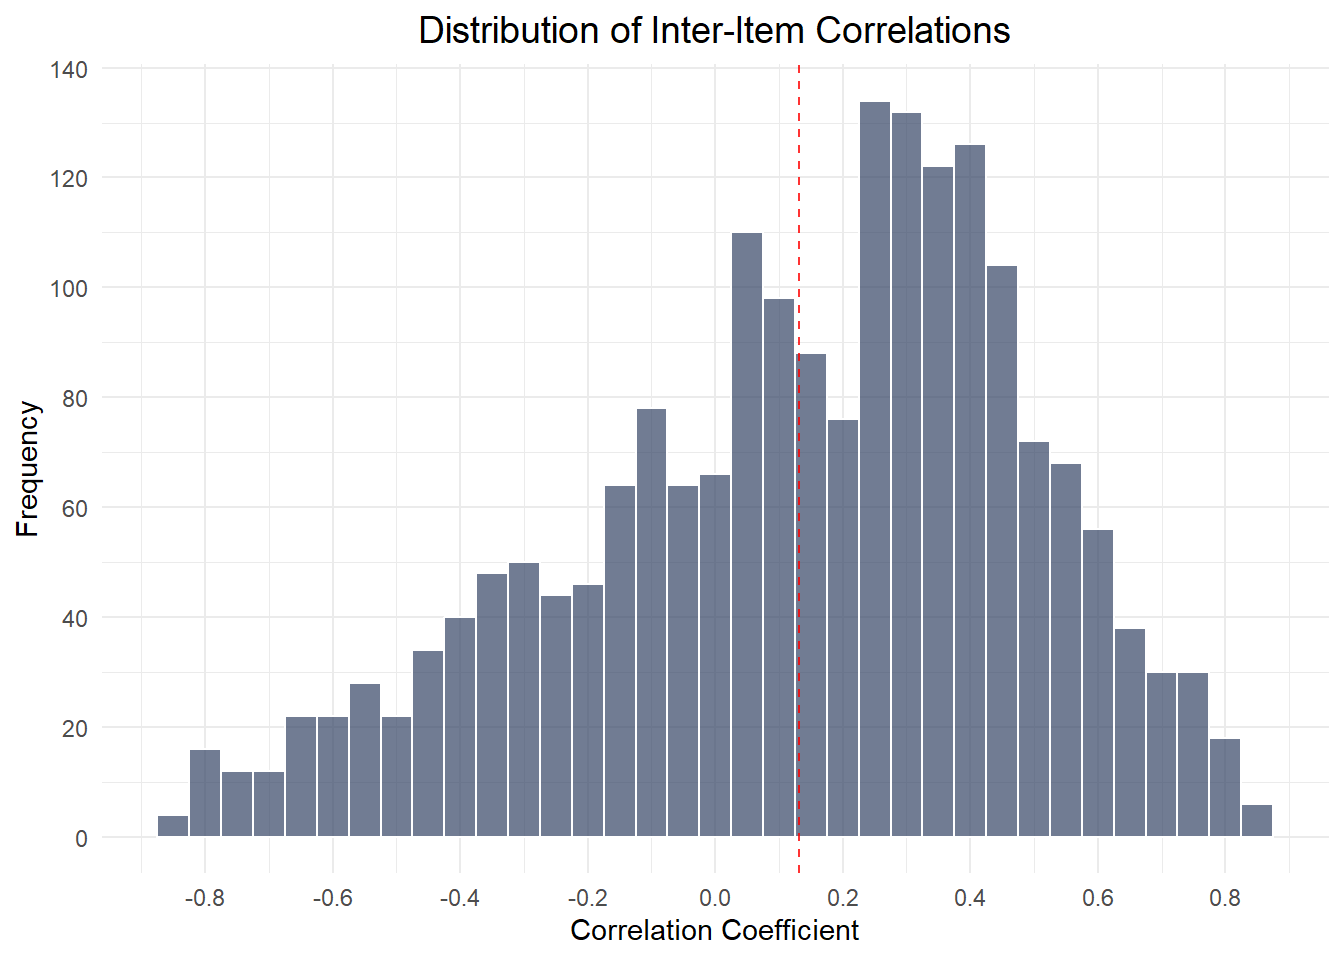
Inter-item correlation analysis
Total survey items (excluding attention checks): 45 Correlation summary statistics
| Statistic | Value |
|---|---|
| Mean Correlation | 0.132 |
| Median Correlation | 0.187 |
| Standard Deviation | 0.361 |
| Minimum Correlation | -0.841 |
| Maximum Correlation | 0.858 |
| 25th Percentile | -0.100 |
| 75th Percentile | 0.392 |
Problematic correlations
Highly correlated items (r> .85-.90) can create statistical problems of multicolliniarity during analysis, making it difficult to interpret regression analysis/structural equation modelling. Further, they may indicate redundancy and inefficiency in the scale, by measuring the same construct twice. However, this is less of an issue with a long-form draft scale where the intention is to reduce the number of items following analysis.
| Item_1 | Item_2 | Correlation |
|---|---|---|
| Item_29 | Item_36 | 0.858 |
Correlation distribution
Items within unidimensional scales would be expected to strongly correlated (typically r>.50-.80). However, items within multidimensional scales, where the dimensions are not independent and theoretically related might show weaker correlations (r>.10-.50).
6. Recommendations for Full Study
Survey Modifications
Items requiring revision
- Consider revisions to Items 1, 4, 6-7, 9, 18, 24-27 & 32 to improve discriminant validity
- Remove attention checks from paper-based surveys
Changes to format
- Remove randomisation from paper-based surveys to aid data entry
- Ensure Prolific ID is a mandated field
Data Collection Protocols
Participant screening
- Consider additional focus on participants from ethnic minorities, and younger people on low incomes.
Sample size considerations
Integration with Main Dataset
Feasibility assessment:
- Can pilot data be included in main analysis?
- Not possible to exclude those who have already participated.
- Wording of some items to be revised
- Not possible to exclude those who have already participated.
Appendices
Appendix A: Correlation Matrix
[Include full inter-item correlation matrix]