“The extent to which one understands digital technologies and approach digital health resources critically, including in the selection, evaluation, and application of digital technologies.”
“Perception of one’s abilities to effectively engage and use digital technologies safely in areas including health information gathering, communication, content creation, and problem solving.”
“The behaviours around digital technologies that are either typical or seen as proper in each context.”
“The confidence that users have in the integrity, security, and privacy of digital technologies”.
“The extent to which individuals are confident in their ability to use digital technologies effectively.”
“The reasons why people engage with digital technologies. The extent to which individuals are inclined towards using digital technologies to improve or maintain health.”
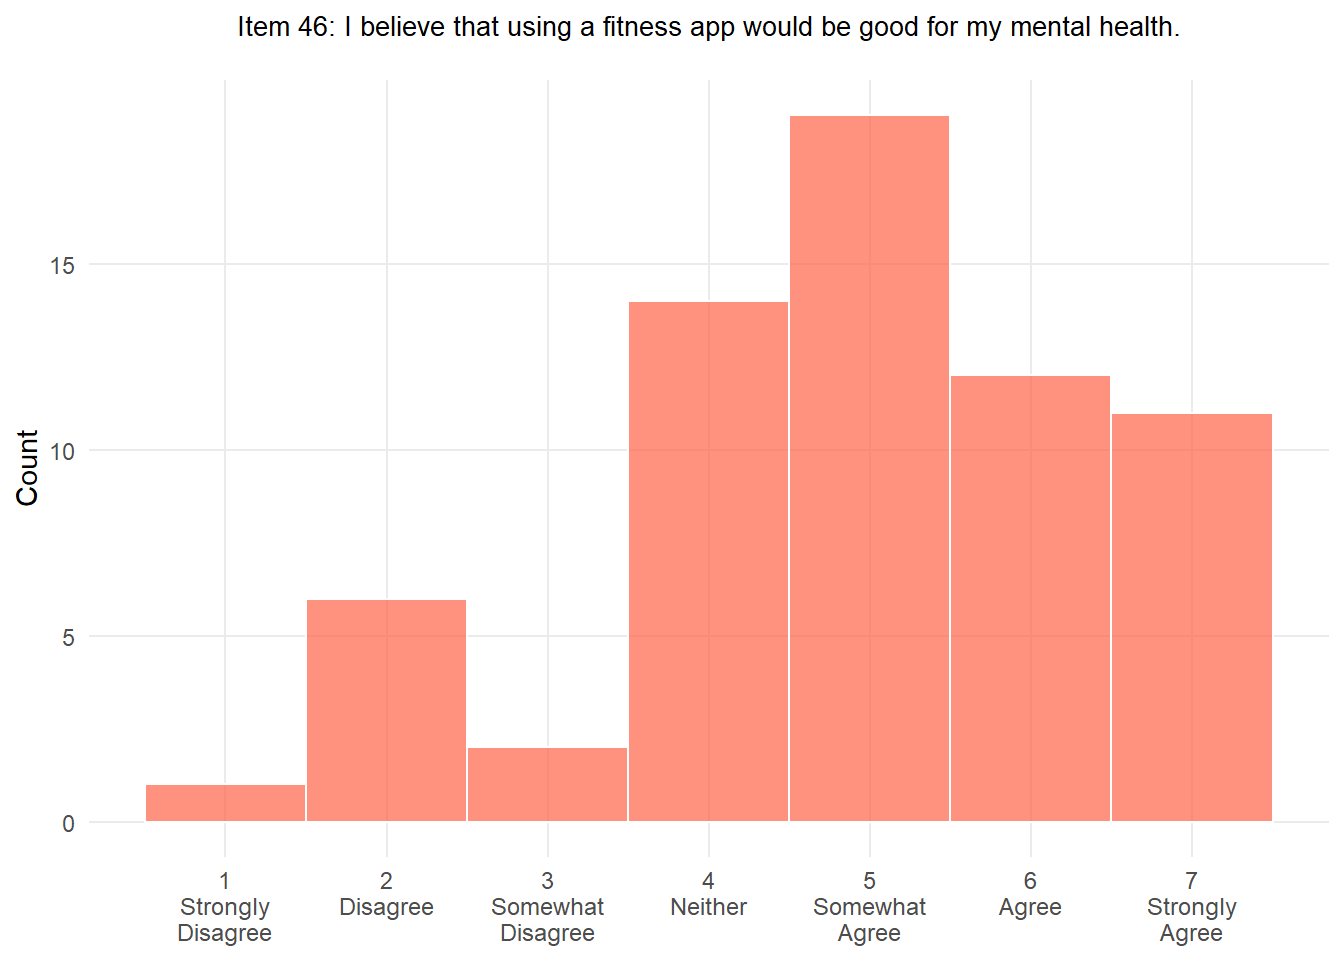
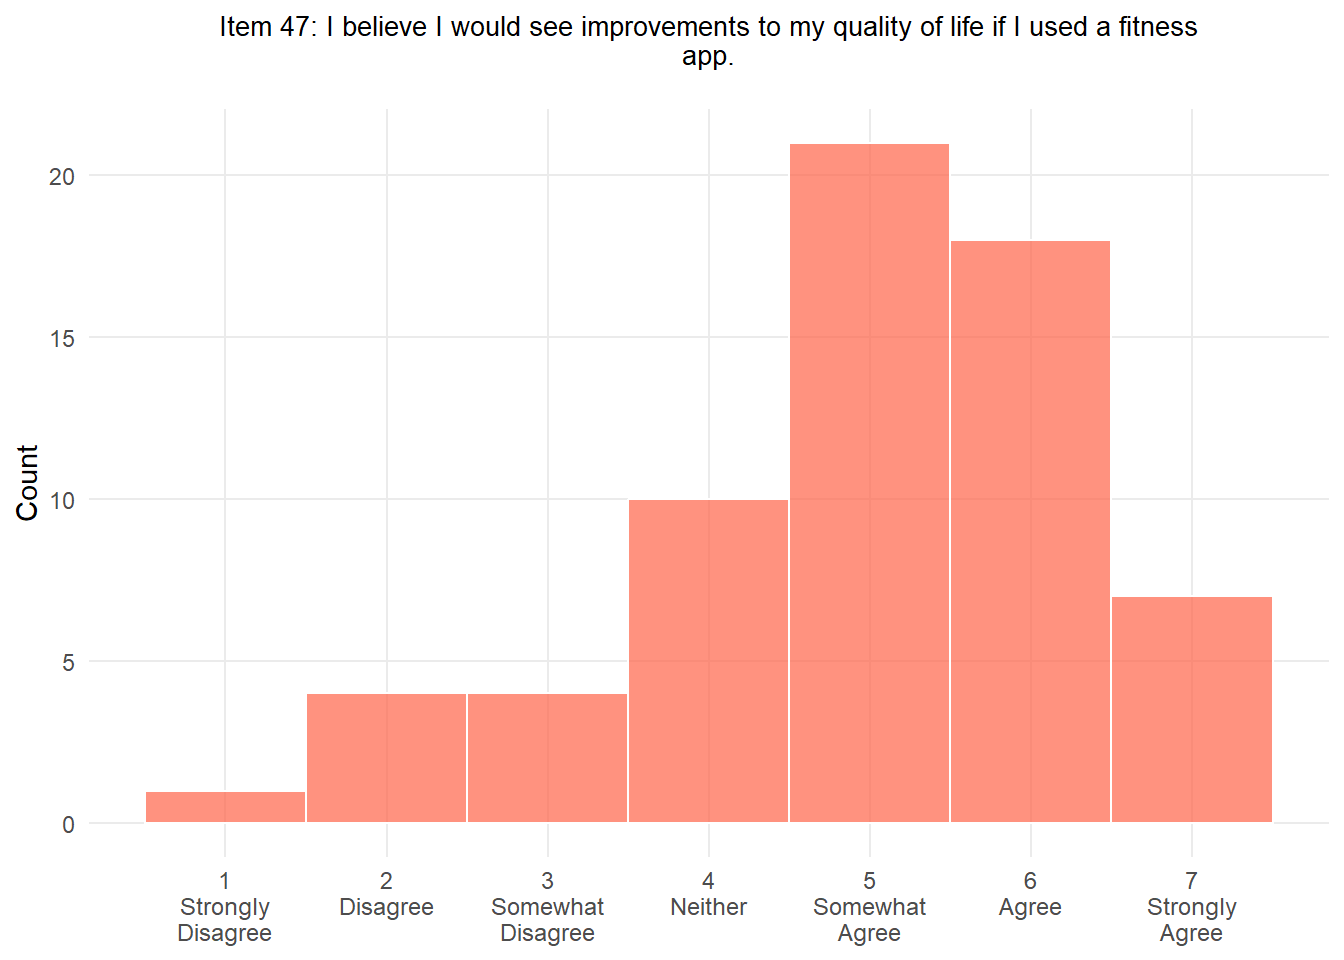
“An individual’s beliefs about the likely physical, social, or self-evaluative outcomes of engaging with digital health technologies.”
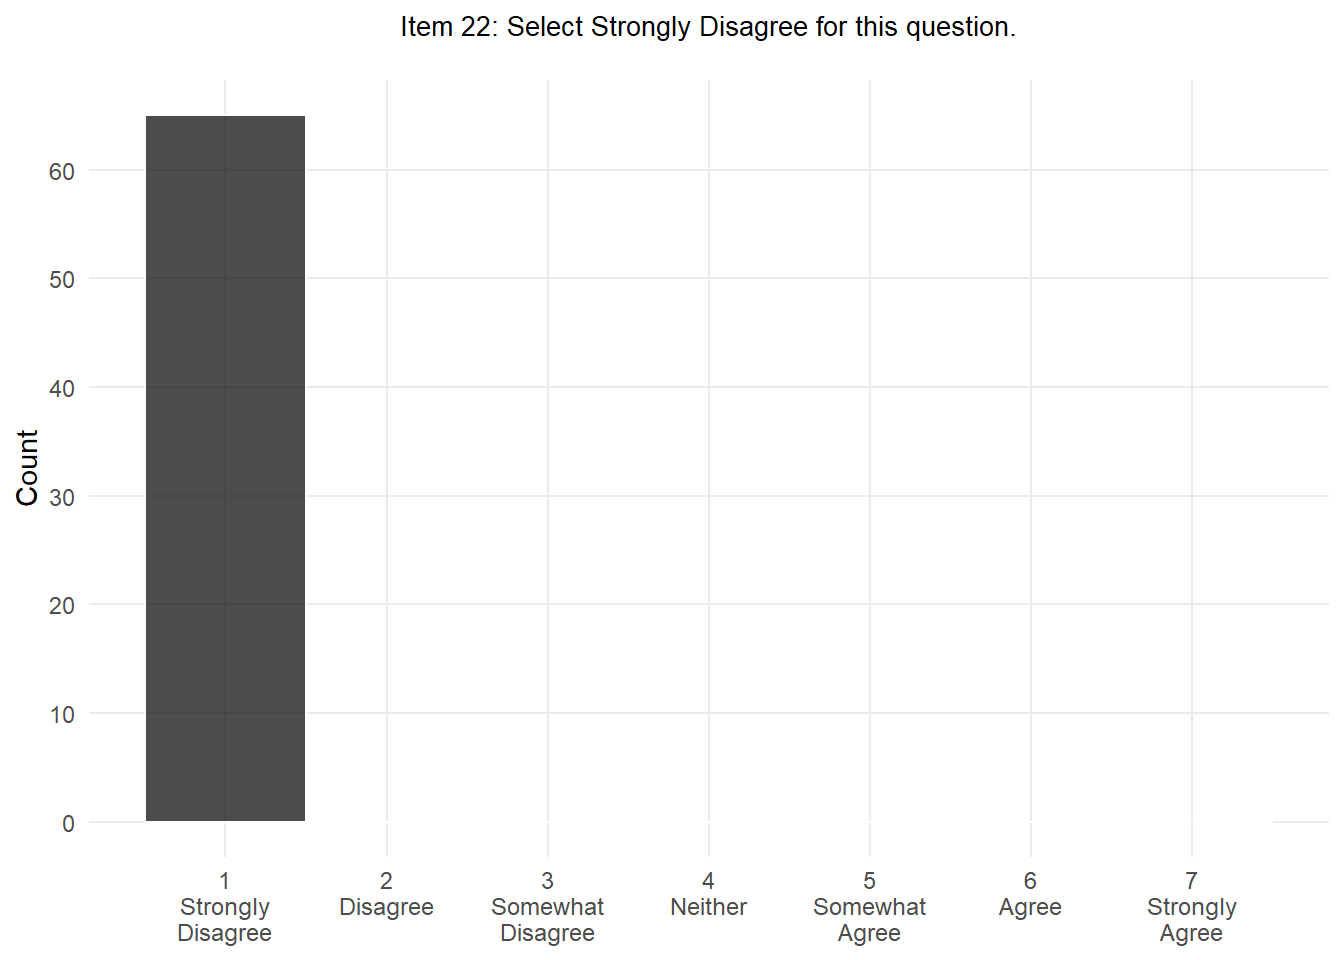
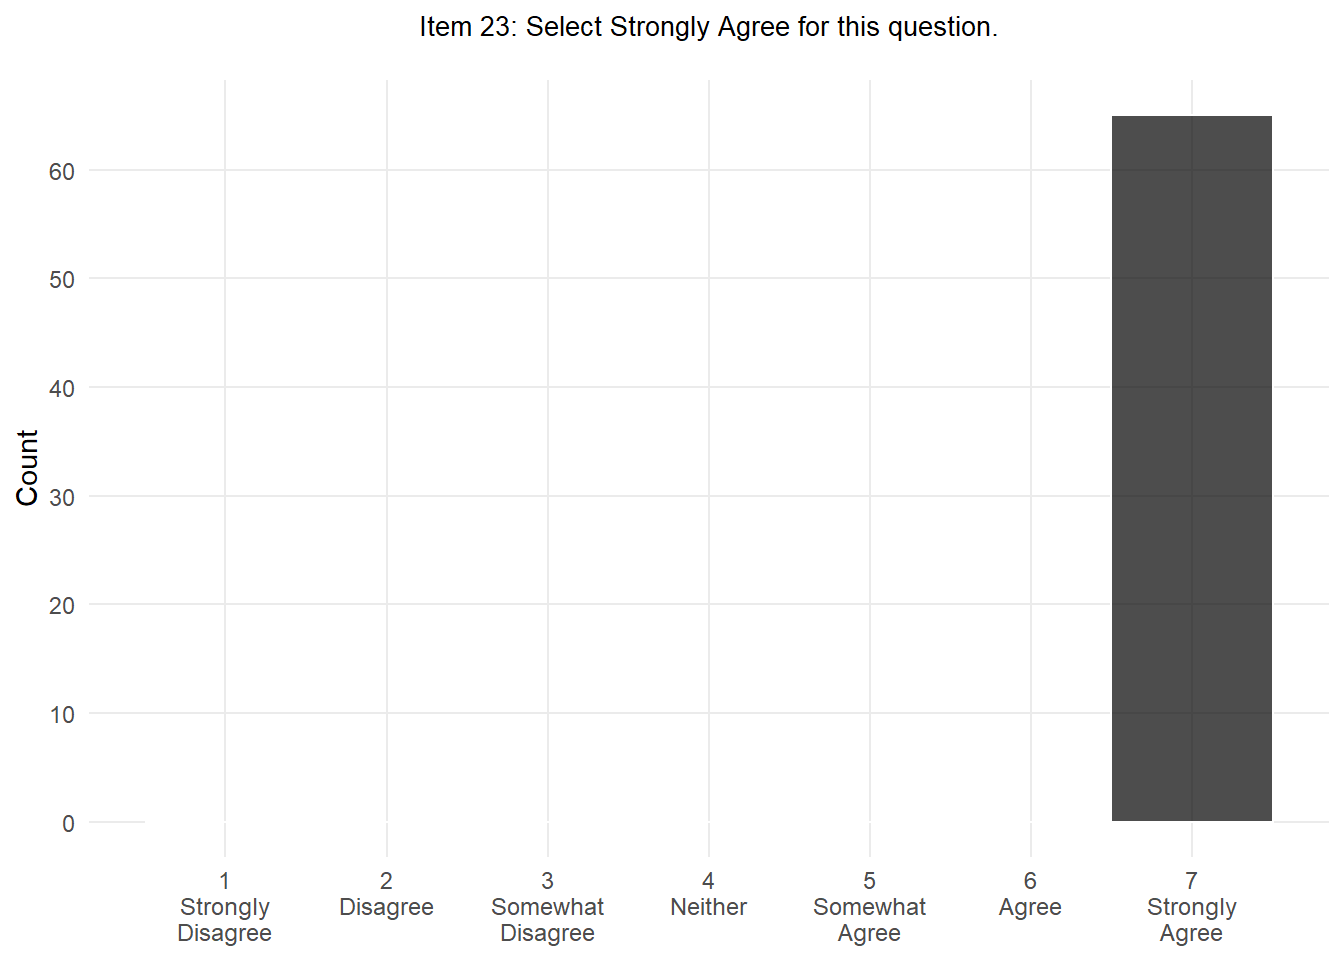
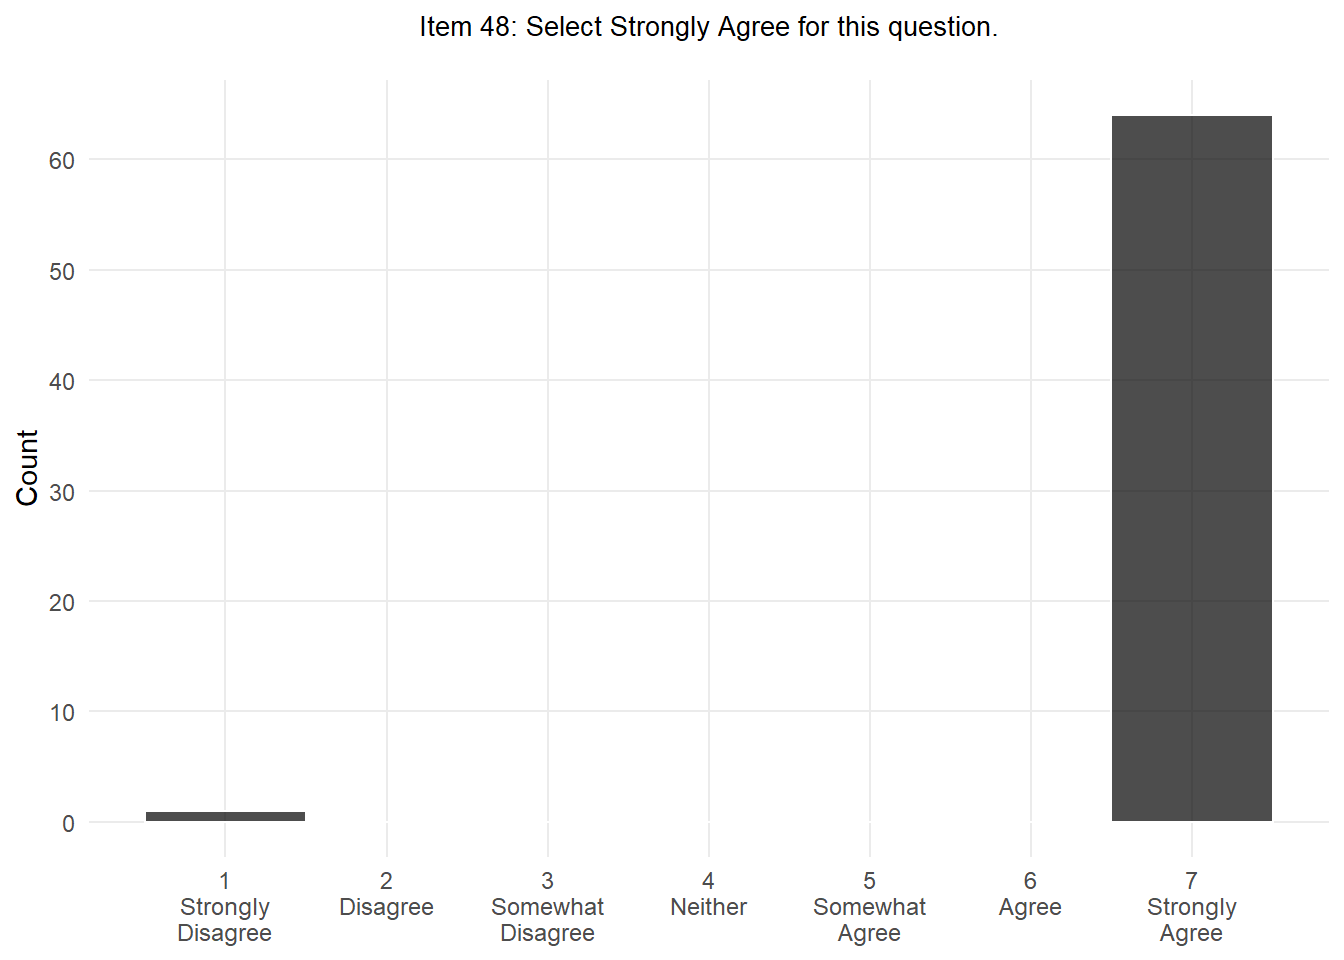
Four attention checks are added to the survey as a means of testing whether participants are actively engaging with the questions. Participants are directly to select either Strongly Agree or Strongly Disagree.

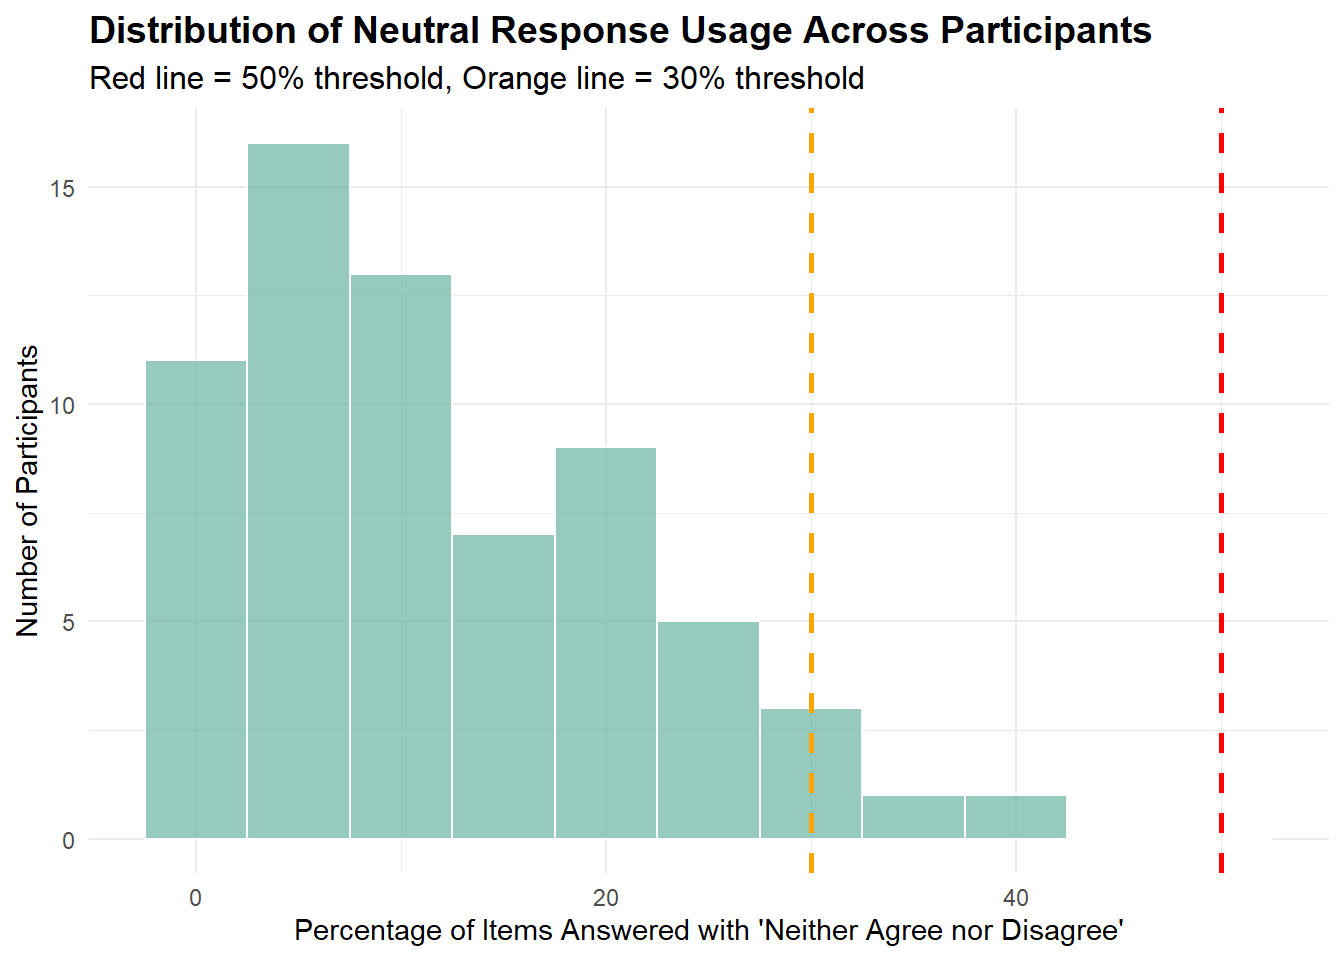
Once concern with the inclusion of a neither agree nor disagree option, is that participants use it to indicate they don’t think the item is applicable, or they don’t understand the question, rather than a graduate response between slightly disagree and slighty agree.
To test this, we can review the items where participants have disproportionately selected the neutral option.
## Summary of Neutral Response Patterns**Overall Statistics (excluding attention checks):**- Mean neutral response rate: 12 %- Median neutral response rate: 10.6 %- Range: 0 % - 45.5 %- Items with ≥ 30 % neutral responses: 2 out of 45 **By Construct:**| Construct | # Items | Mean Neutral % | Max Neutral % | Problematic Items |
|---|---|---|---|---|
| Sociodigital Influences | 6 | 17.9 | 45.5 | 1 |
| Digital Trust | 5 | 17.0 | 22.7 | 0 |
| Digital Health Literacy | 5 | 16.1 | 31.8 | 1 |
| Digital Outcome Expectancy | 6 | 15.4 | 21.2 | 0 |
| Digital Behavioural Regulation | 12 | 10.4 | 19.7 | 0 |
| Digital Skills | 5 | 5.1 | 10.6 | 0 |
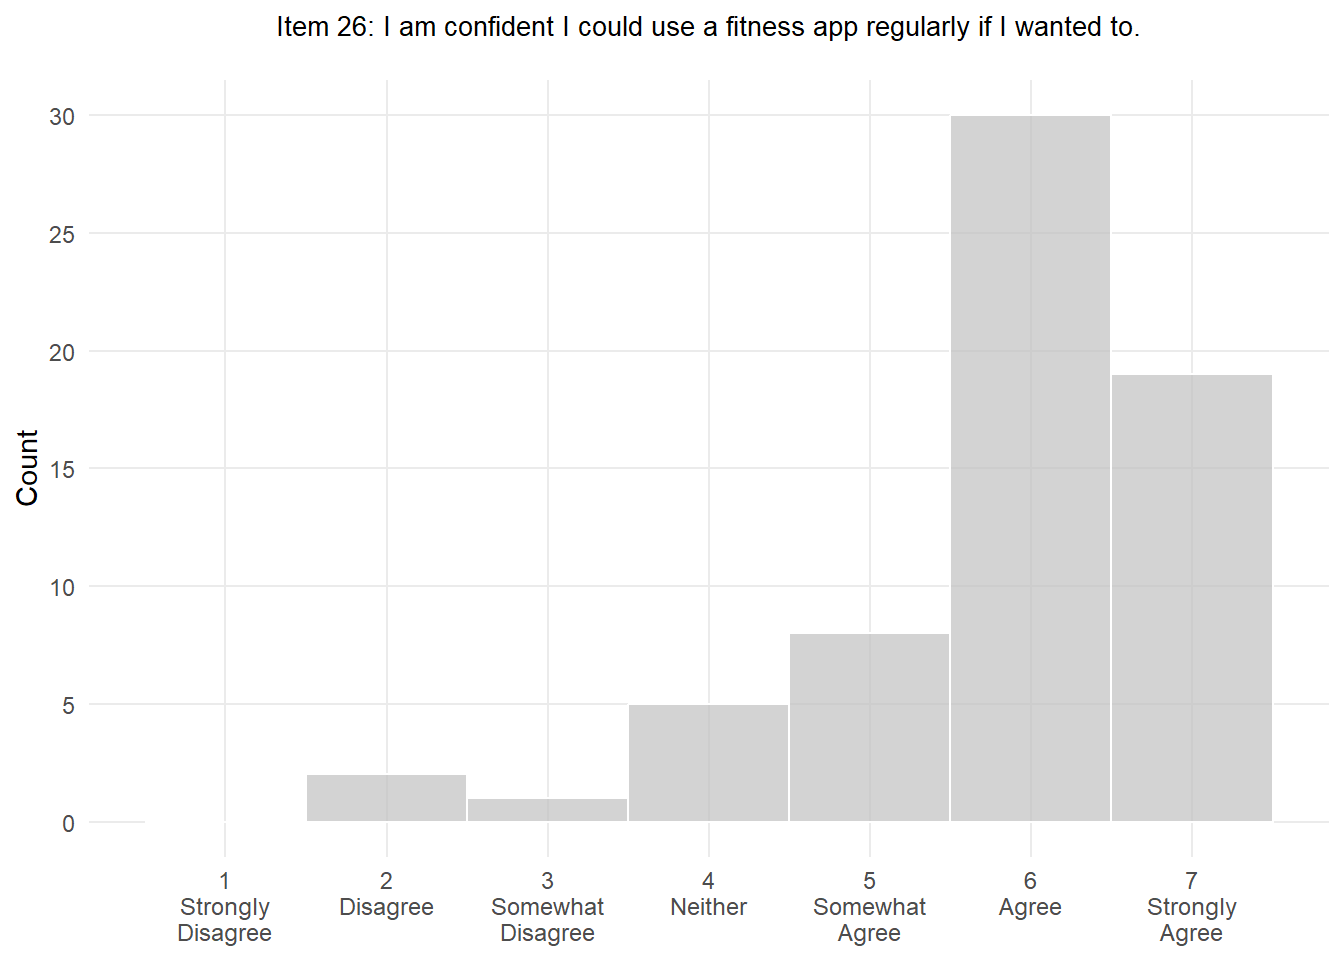
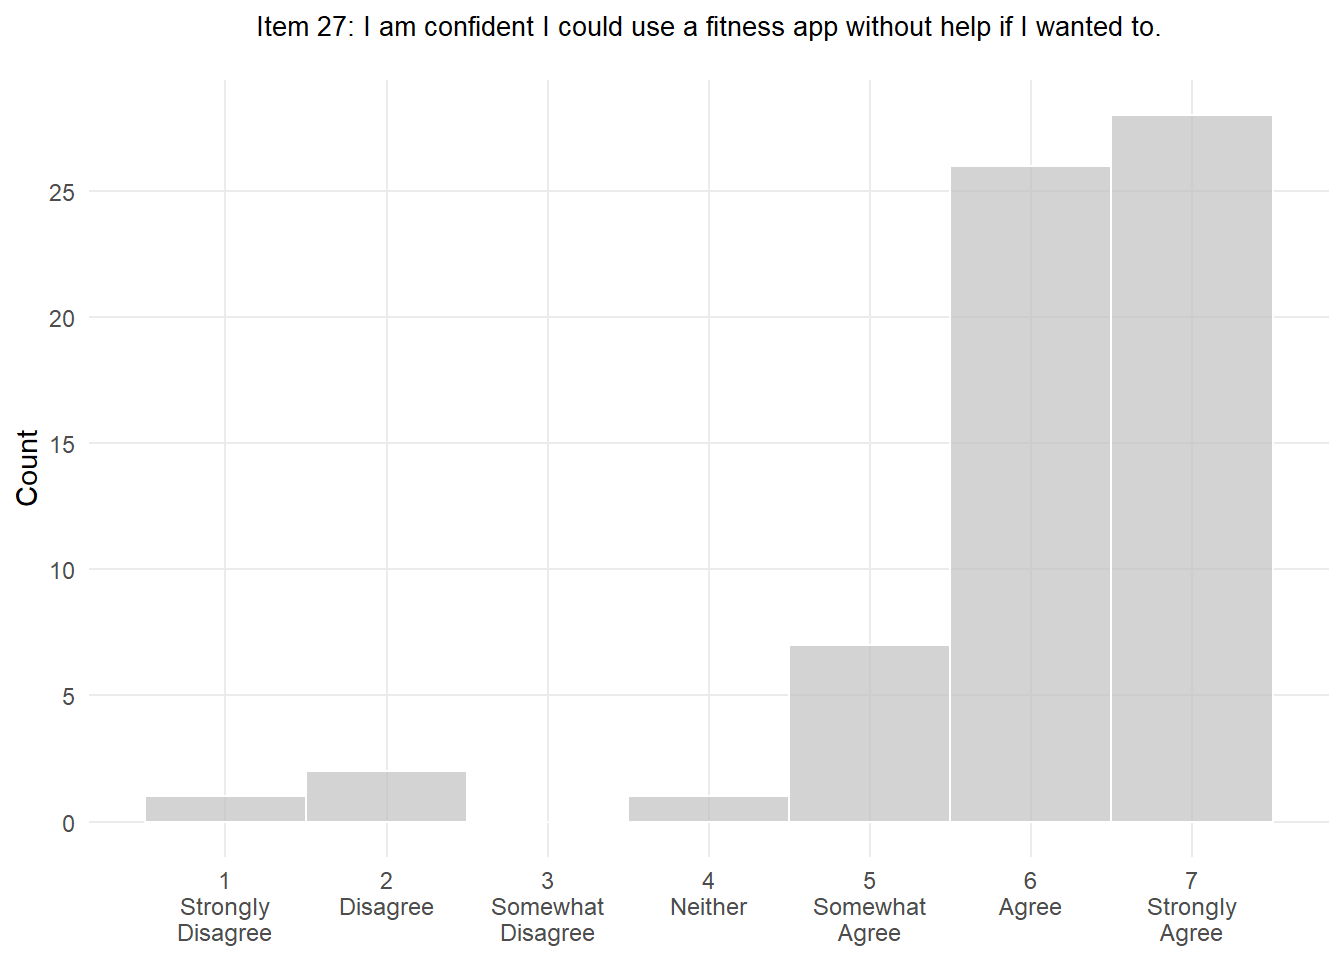
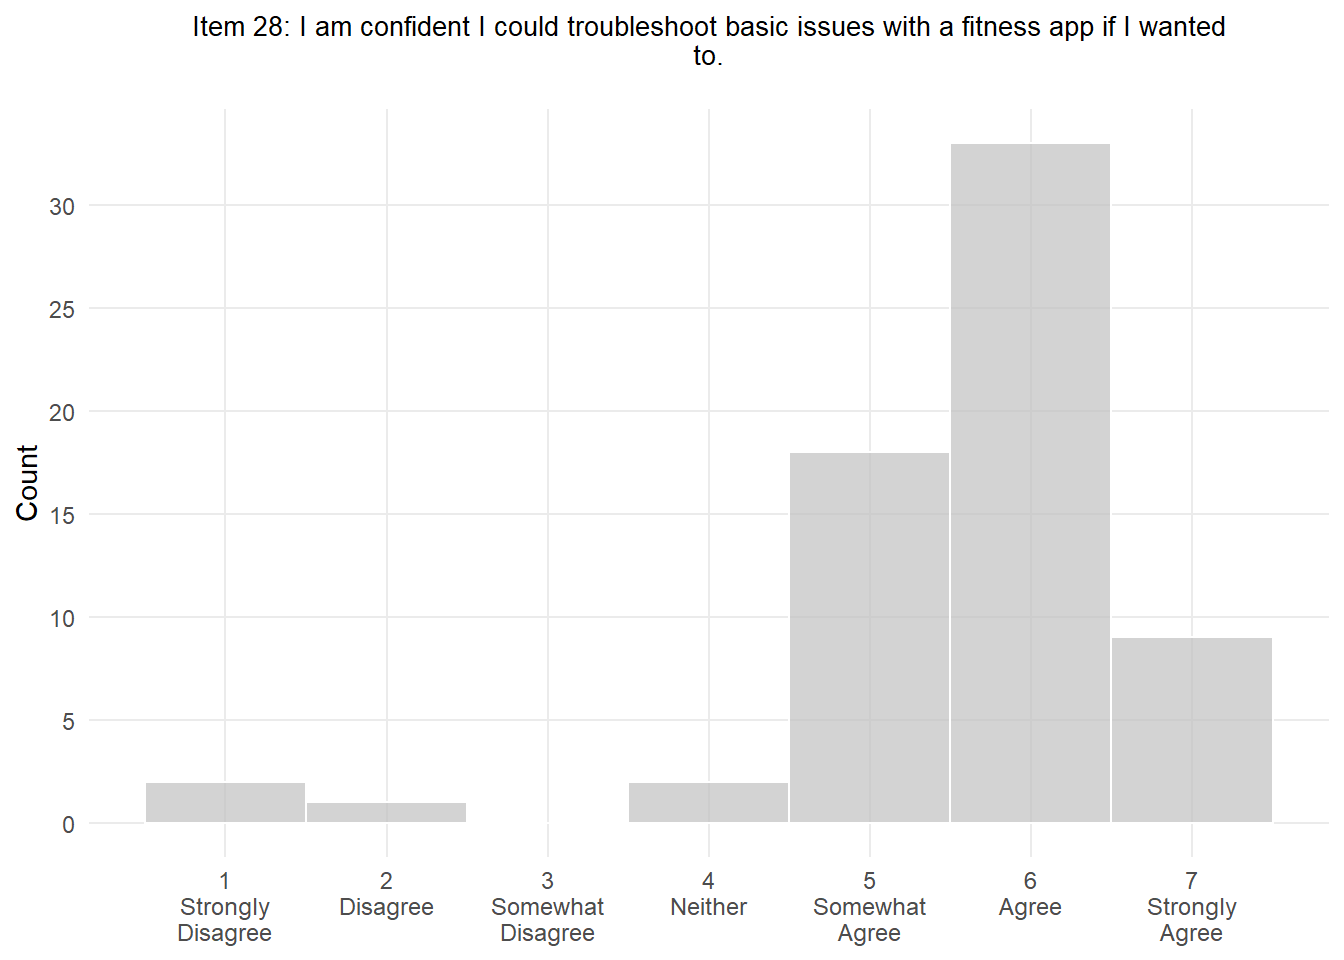
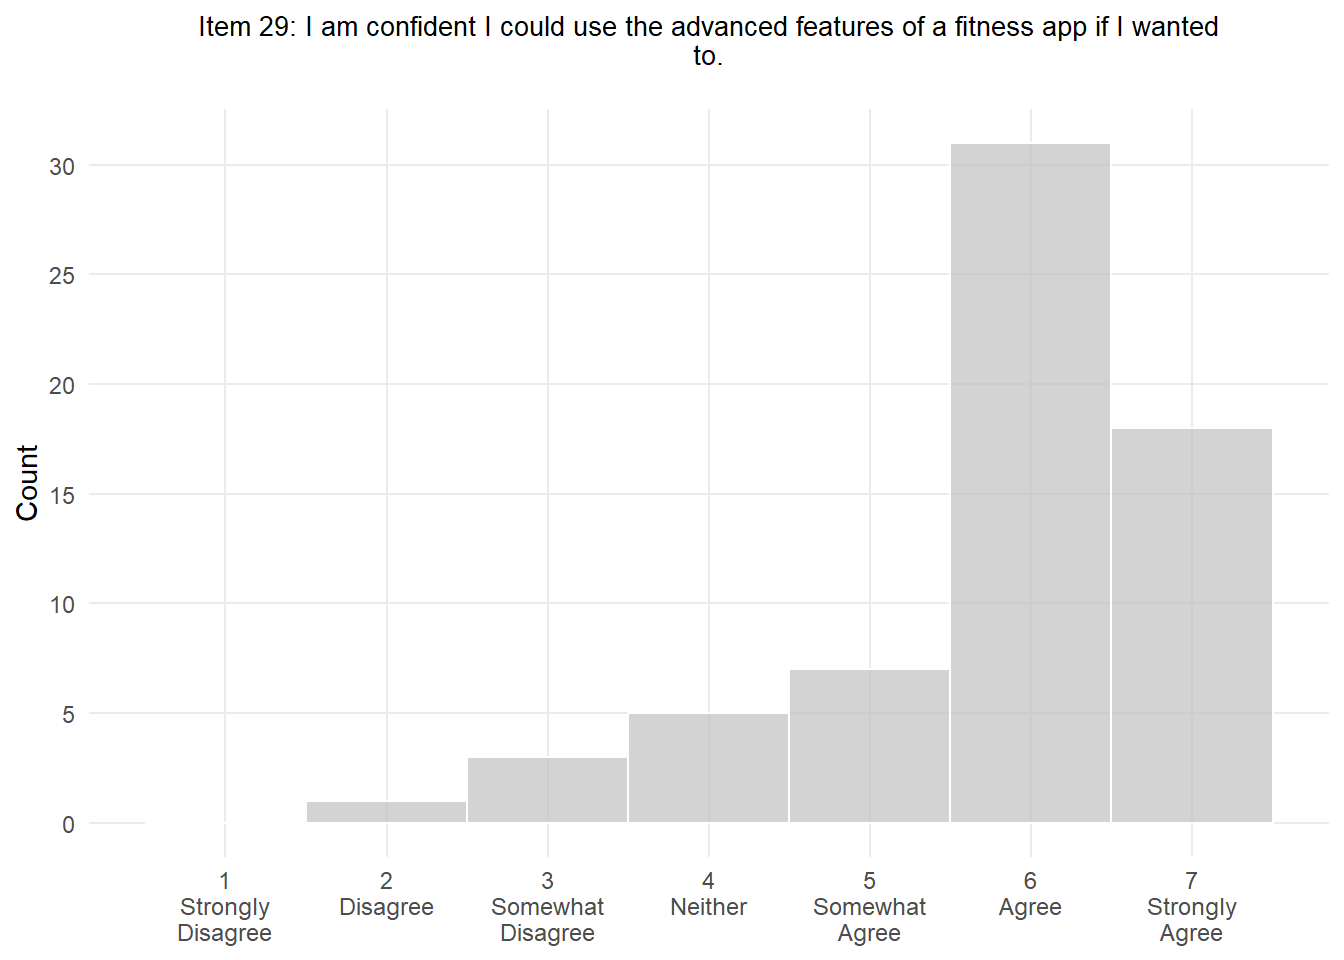
| Digital Self-Efficacy | 6 | 4.3 | 7.6 | 0 |
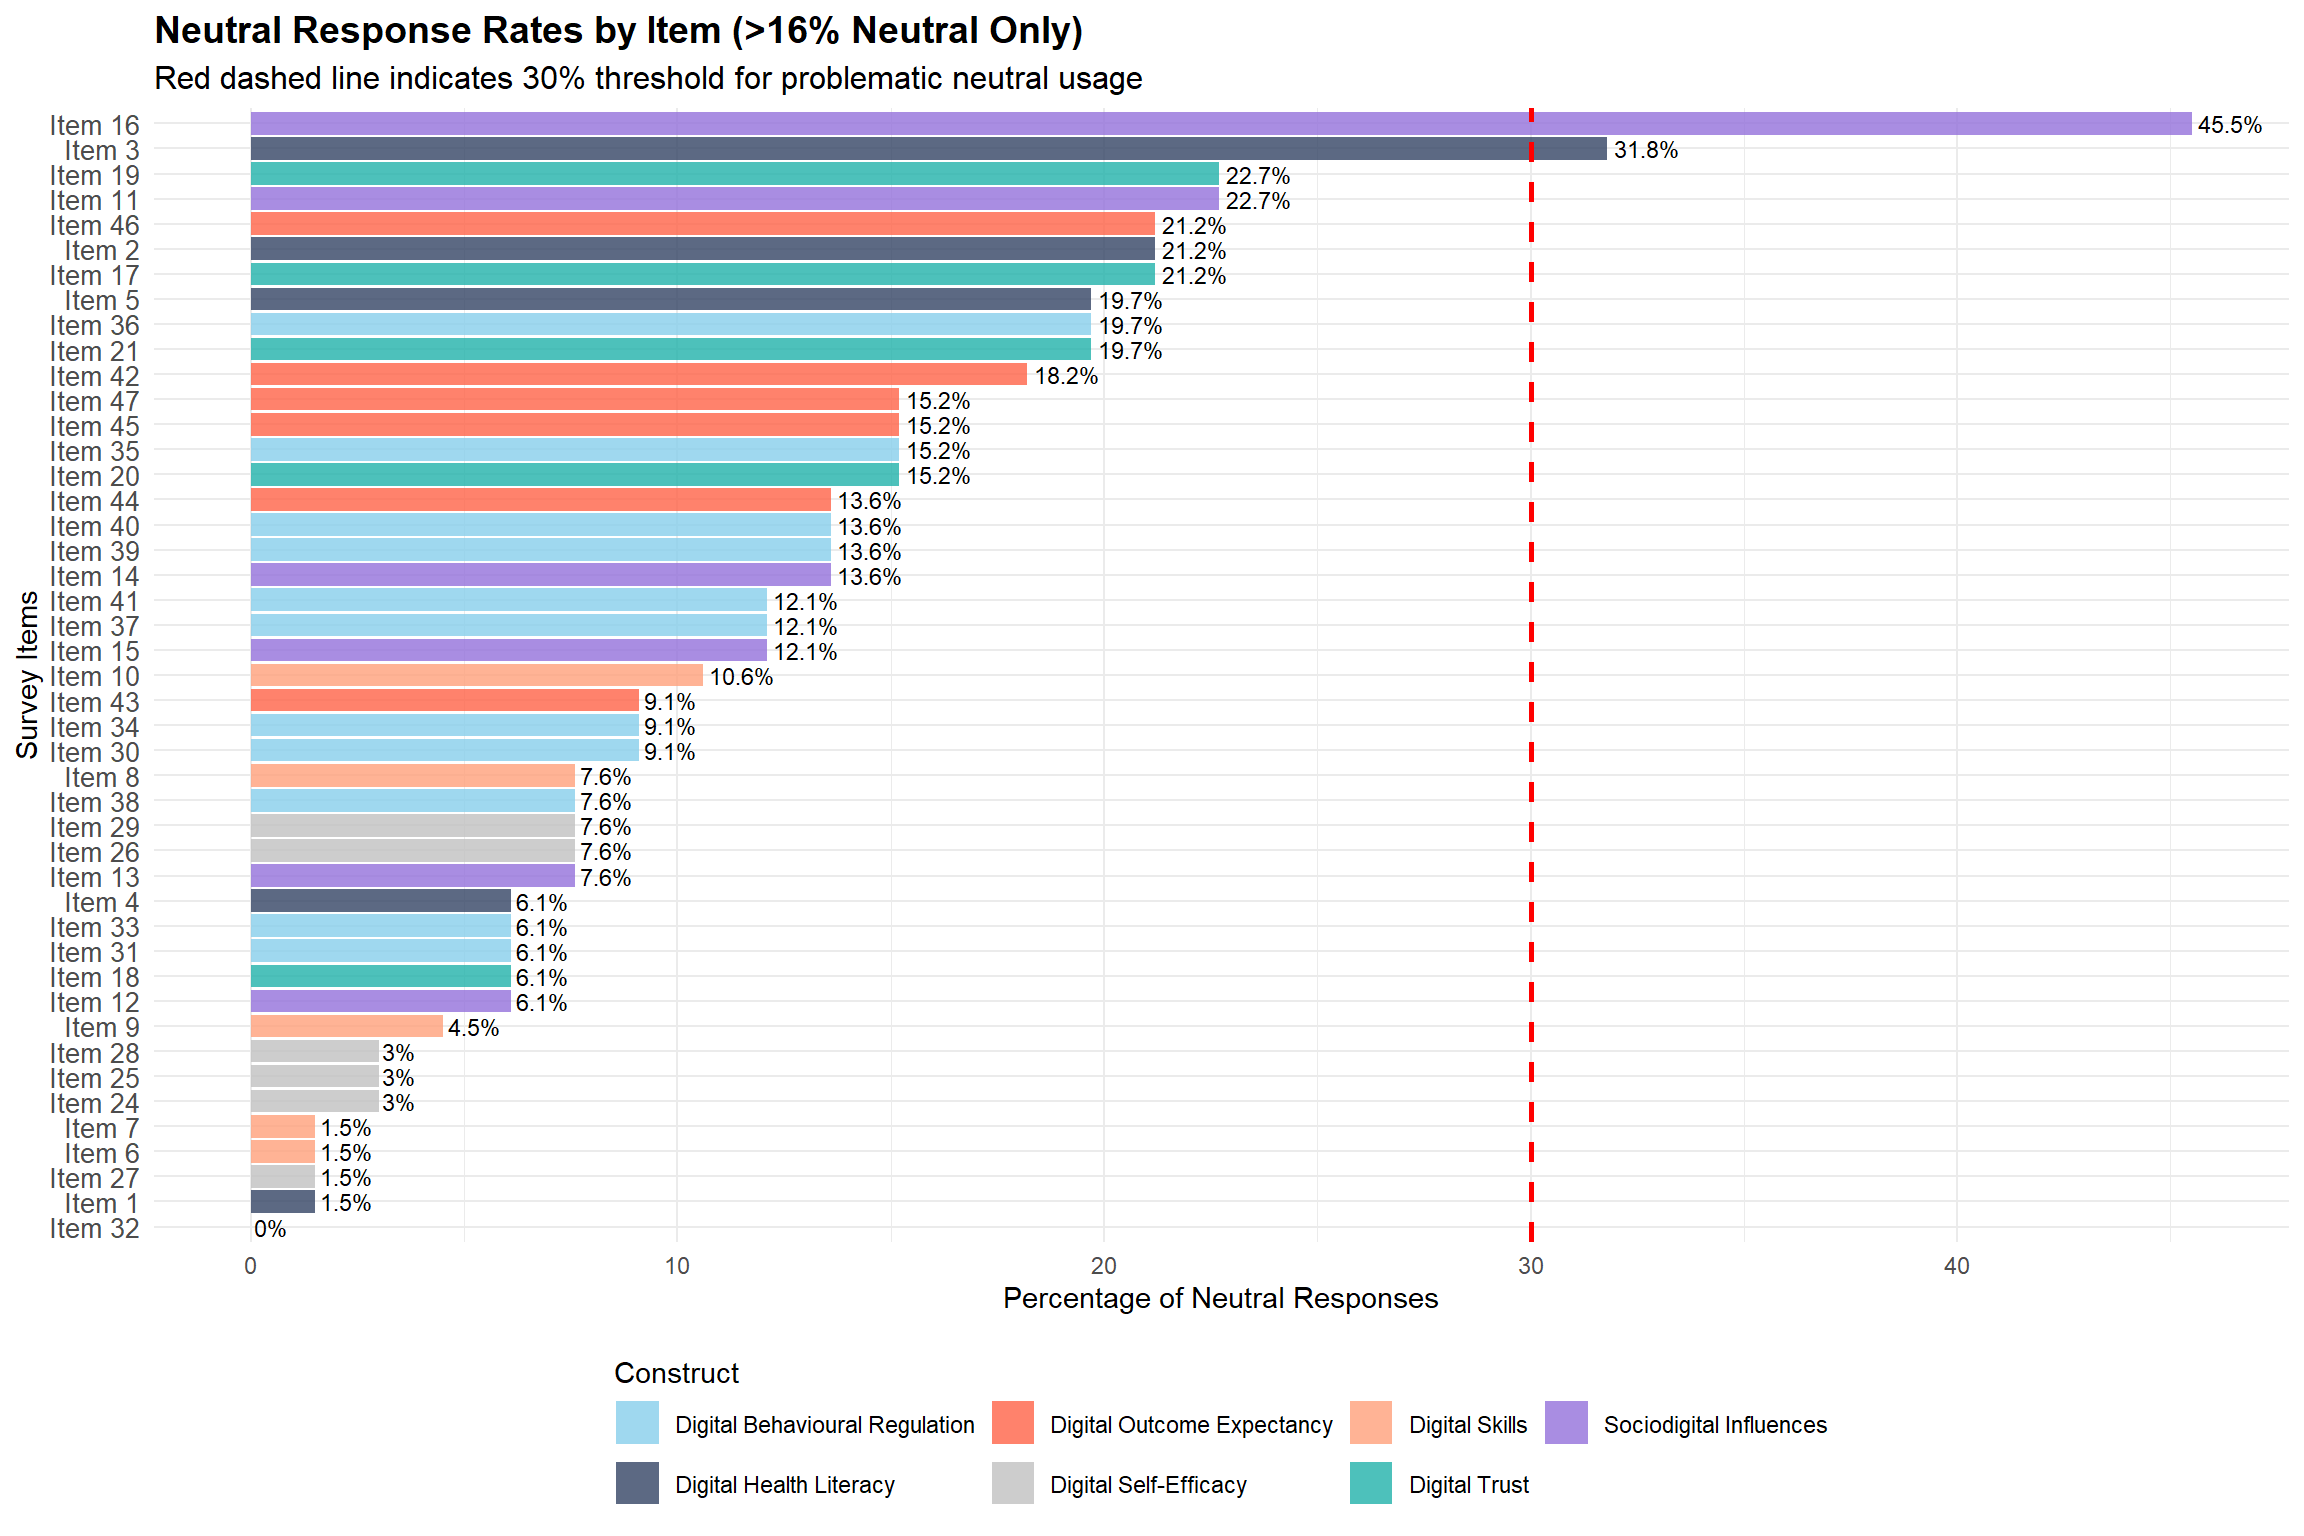
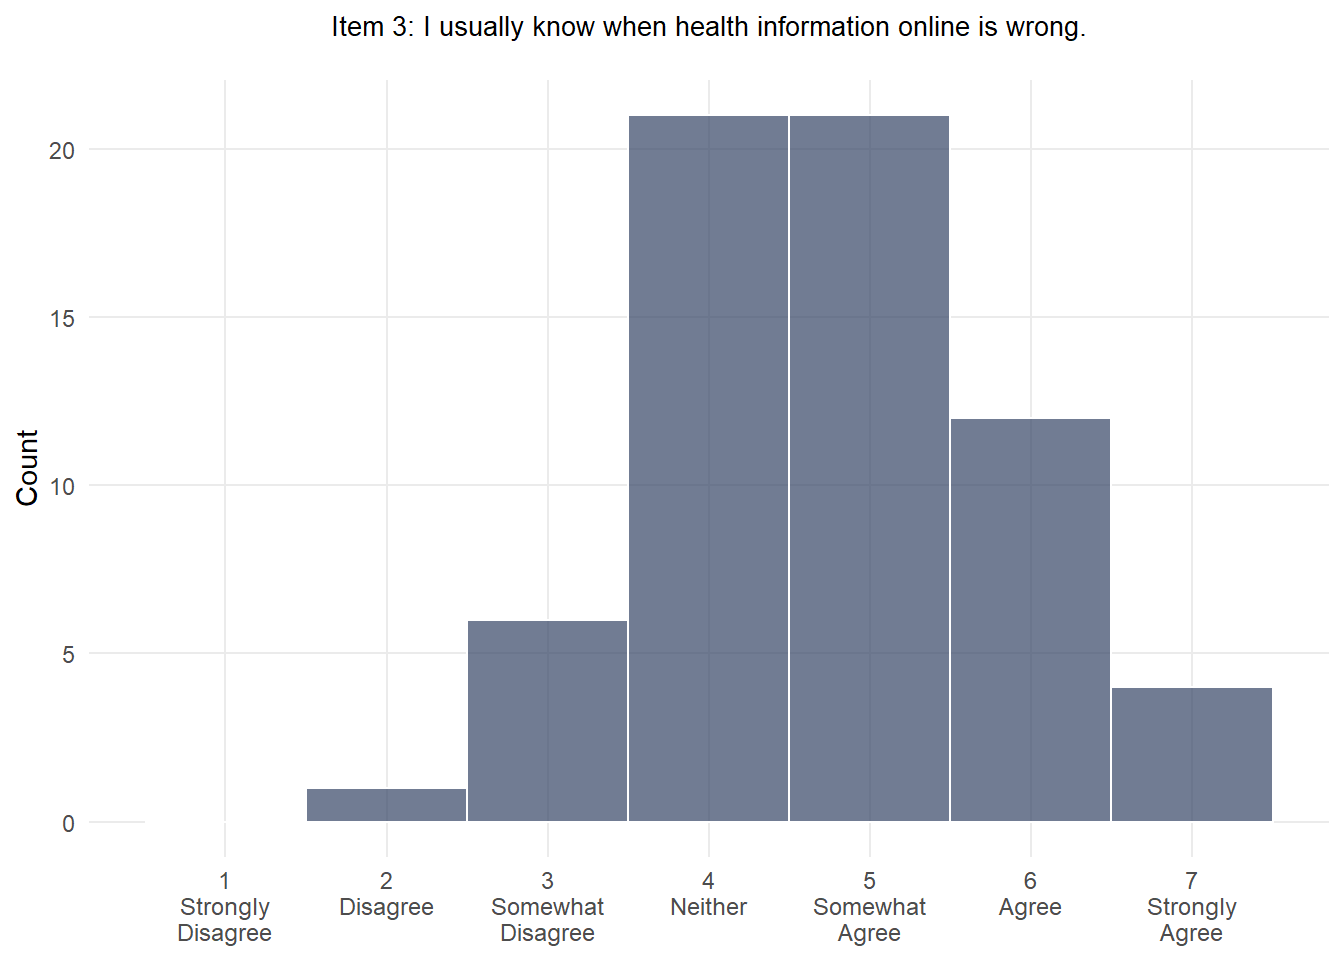
Participants selected the neutral option more than 30% of the time in two cases: Item 16 and Item 3.
On examination of the distribution and skew (see above) the distribution of responses to Item 3 approximates a normal distribution with around 30% of respondents also selecting slightly agree, suggesting that participants are engaging meaningfully with the item, but reporting s genuine moderate or low agreement position.
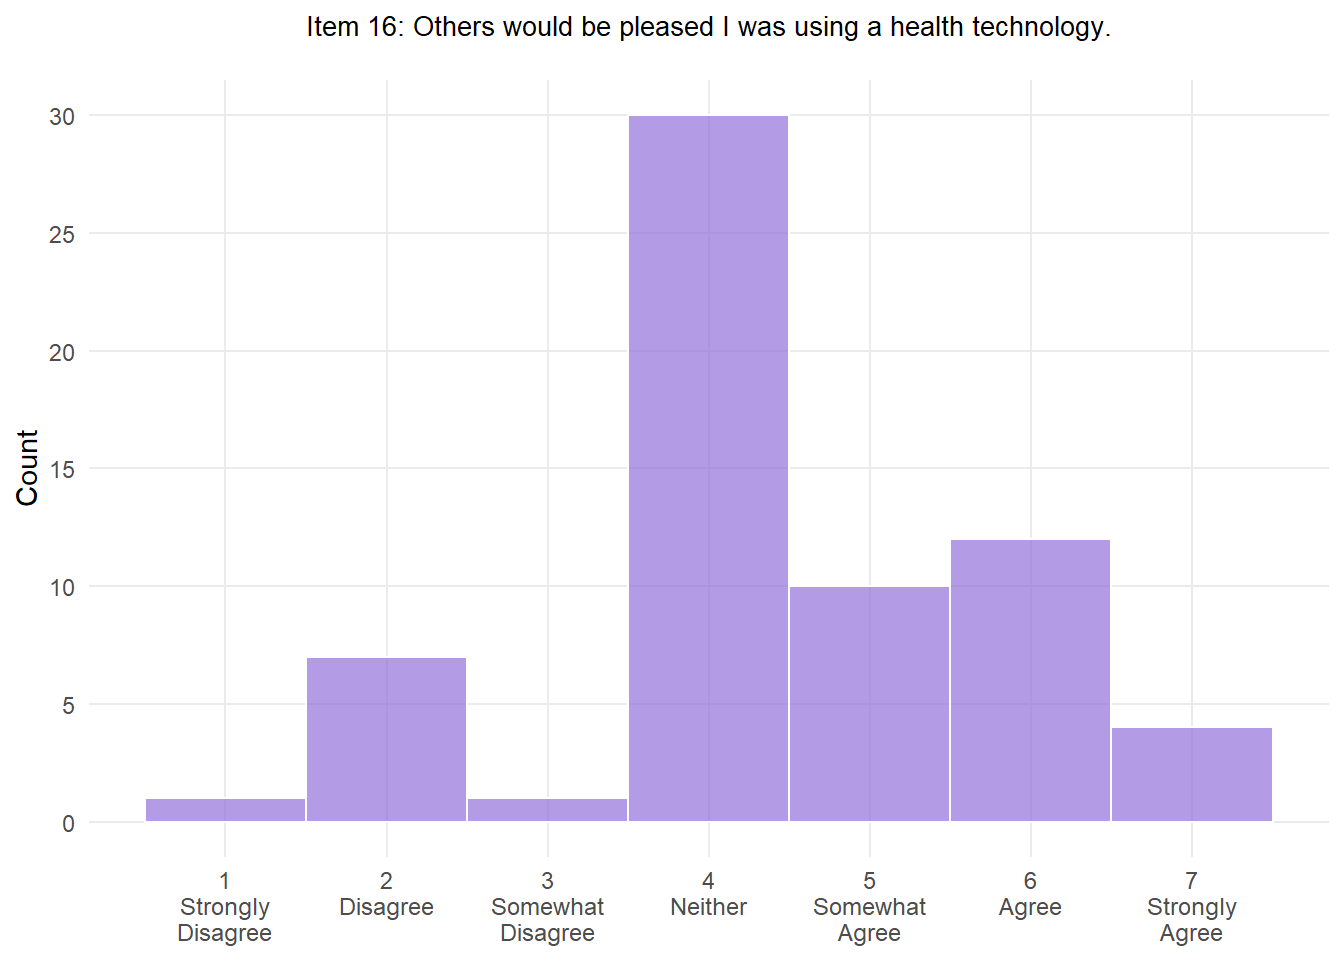
The distribution of responses to Item 16 represents more of a significant concerning with nearly half the sample selecting the neutral option.
Item 16: “Others would be pleased I was using a health technology”.
This item was also problematic at cognitive interviews, with a number of interviewers saying either they wouldn’t know if others would be pleased they were using a health technology, or not being clear who ‘others’ referred to.
This suggests the item may be capturing uncertainty, rather than genuine social influence on tech use, and consideration should be given to revising or replacing this item.
| Metric | Value |
|---|---|
| Mean neutral response rate | 12% |
| Median neutral response rate | 10.6% |
| Range | 0% - 45.5% |
| Items with ≥30% neutral responses | 2 out of 45 (4.4%) |
| Total items analyzed | 45 |
### By Construct| Construct | # Items | Mean Neutral % | Max Neutral % | Problematic Items |
|---|---|---|---|---|
| Sociodigital Influences | 6 | 17.9 | 45.5 | 1 |
| Digital Trust | 5 | 17.0 | 22.7 | 0 |
| Digital Health Literacy | 5 | 16.1 | 31.8 | 1 |
| Digital Outcome Expectancy | 6 | 15.4 | 21.2 | 0 |
| Digital Behavioural Regulation | 12 | 10.4 | 19.7 | 0 |
| Digital Skills | 5 | 5.1 | 10.6 | 0 |
| Digital Self-Efficacy | 6 | 4.3 | 7.6 | 0 |

| Metric | Value |
|---|---|
| Participants who used neutral ≥50% of the time | 0 out of 66 (0%) |
| Participants who used neutral ≥30% of the time | 2 out of 66 (3%) |
| Mean participant neutral usage | 12% |
| Median participant neutral usage | 8.9% |
| Total participants | 66 |