Data Summary
This report presents preliminary analyses of a digital health readiness scale developed to assess individuals’ preparedness to engage with digital health technologies. The scale comprises 45 items across seven theoretical sub-constructs: Digital Health Literacy, Digital Skills, Sociodigital Influences, Digital Trust, Digital Self-Efficacy, Digital Behavioural Regulation, and Digital Outcome Expectancy.
The analyses below examine item-level performance, including mean responses, internal consistency, and factor structure based on pilot data from 50 participants. Given the small sample size, these results should be interpreted cautiously and are intended to identify potential measurement issues and guide scale refinement prior to full scale validation.
Note: This is pilot-stage data analysis. Additional participants who completed paper versions of the survey are yet to be included, which may alter the patterns observed here.
Item score means
Visualising item score means is useful for the following reasons:
1. Ceiling/floor effects:
Items with a mean around 1-2 suggests strong disagreement - might indicate items that don’t resonate or are poorly worded. Items with a mean near 6-7 suggest strong agreement or socially desirable responding. Items with a mean around 4 suggest neutral responses which might indicate ambiguous wording (“I’m unsure how to answer this”) or genuine ambivalence.
For example, few people are likely to disagree with the statement:
‘I would expect health technologies to have measures in place to keep my information safe’,
…limiting its ability to discriminate between individuals.
2. Response patterns across subconstructs:
Visualising means helps to identify broad response patterns across different sub constructs. For example, Digital Skills items (6-10) may show higher means if respondents feel confident with basic technology whereas Trust items (17-21) might cluster around the midpoint if respondents have mixed feelings about data security.
In general, we would expect means and responses distributions to vary between constructs measuring different things.
3. Problematic items to investigate:
Things to look out for:
- Extreme outliers (much higher/lower than similar items) - check wording
- Items well below midpoint - might be reverse-coded or poorly understood
- Attention checks should show expected patterns (Items 22-23, 48-49)
- Are negatively worded items (like Item 9 “I often struggle…”) showing appropriately reversed patterns?
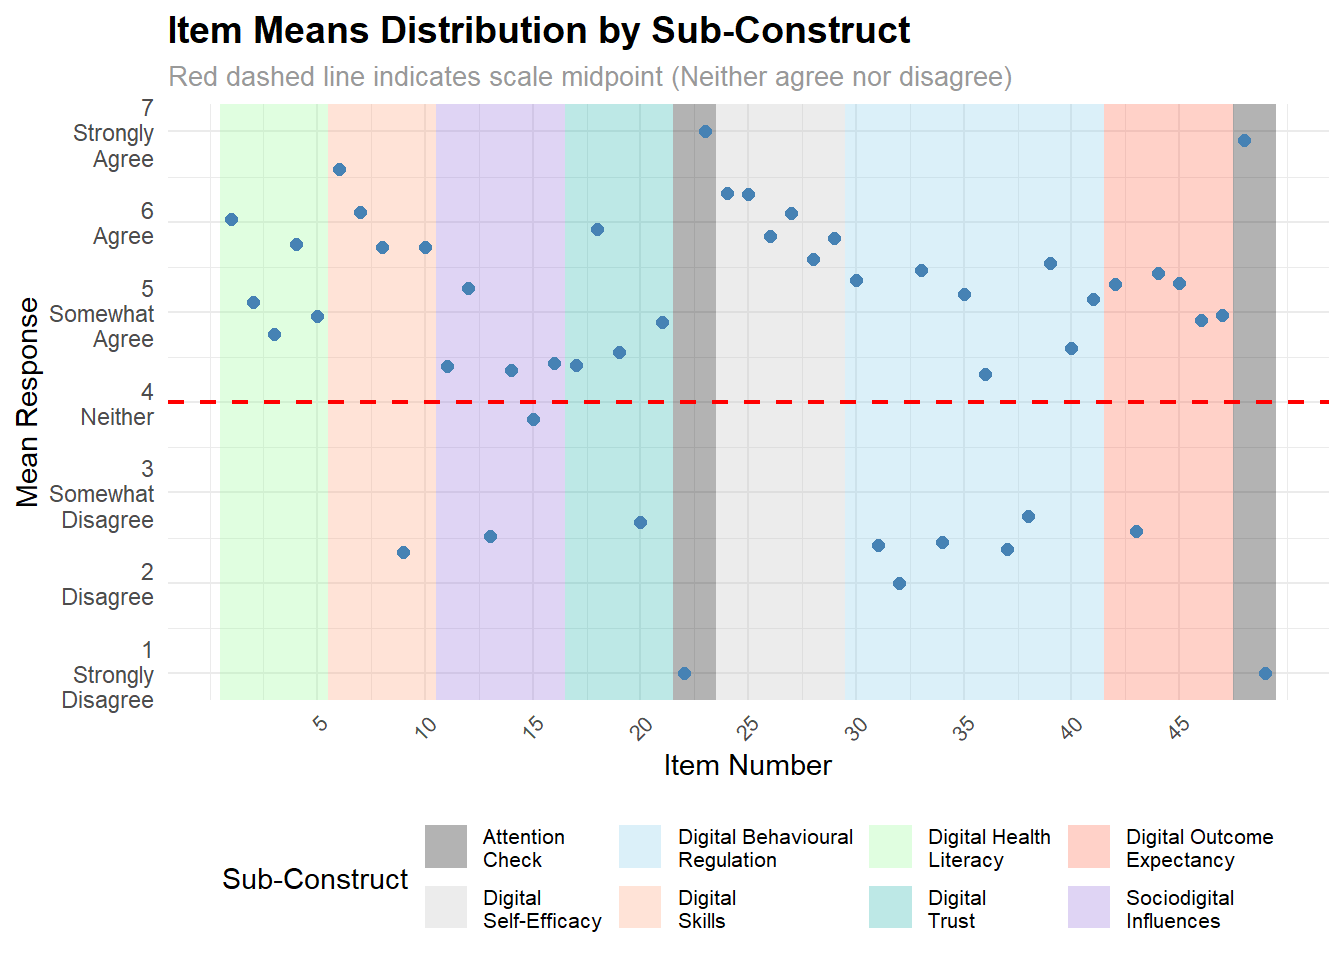
Distribution of item means by sub-construct
The following chart shows the distribution of means across different sub-constructs, prior to reverse coding.
Self-efficacy
Items in the self-efficacy sub-construct all share a high mean score, clustering around 6. This suggests respondents have a high degree of confidence in their own confidence in using adopting a health technology.
This is perhaps surprising given the mean scores for (current) digital score are lower. Further, items that might be expected to score lower, such as:
I am confident I could use the advanced features of a fitness app if I wanted to.
…also scored a relatively high mean (M = 5.82), albeit there was a small difference between online (M = 5.92) and offline (M = 5.47).
Correlation Analysis
How correlated should scale items be?
Devellis et al. (2022) suggest the following thresholds:
- <.60, unacceptable
- .60-.65, undesirable
- .65 and .70, minimally acceptable
- .70 and .80, respectable
- .80 and .90,, very good
- >.90, consider shortening the scale
| Item Text | Sub-Construct | Mean | r with Sub-domain | r with Total Scale | |
|---|---|---|---|---|---|
| Item_1 | I would understand what a health technology was asking me to do to improve my health. | Digital Health Literacy | 6.03 | 0.200 | 0.484 |
| Item_2 | I can usually work out if health information online is reliable. | Digital Health Literacy | 5.11 | 0.253 | -0.068 |
| Item_3 | I usually know when health information online is wrong. | Digital Health Literacy | 4.75 | 0.186 | 0.044 |
| Item_4 | I would understand information about my health from health technologies. | Digital Health Literacy | 5.75 | 0.288 | 0.519 |
| Item_5 | I would know which health technology was right for me. | Digital Health Literacy | 4.95 | 0.221 | 0.473 |
| Item_6 | I can usually download apps. | Digital Skills | 6.58 | 0.502 | 0.564 |
| Item_7 | I can usually use digital technology. | Digital Skills | 6.11 | 0.611 | 0.392 |
| Item_8 | I can troubleshoot basic issues with digital technology. | Digital Skills | 5.72 | 0.603 | 0.409 |
| Item_9 | I often struggle to use digital technology. | Digital Skills | 5.66 | 0.465 | 0.401 |
| Item_10 | I can usually adjust the settings on digital technology to suit my needs. | Digital Skills | 5.72 | 0.500 | 0.541 |
| Item_11 | Those close to me would encourage me to use a new health technology. | Sociodigital Influences | 4.40 | 0.314 | 0.654 |
| Item_12 | Those close to me would help me use a new health technology if needed. | Sociodigital Influences | 5.26 | 0.342 | 0.455 |
| Item_13 | I don't have anyone in my life that could help me use a health technology. | Sociodigital Influences | 5.48 | 0.222 | 0.320 |
| Item_14 | I feel like using health technology is expected these days. | Sociodigital Influences | 4.35 | 0.175 | 0.433 |
| Item_15 | Few people I know use health technologies. | Sociodigital Influences | 4.18 | 0.053 | 0.045 |
| Item_16 | Others would be pleased I was using a health technology. | Sociodigital Influences | 4.43 | 0.266 | 0.344 |
| Item_17 | I would trust a new health technology with my personal details. | Digital Trust | 4.42 | 0.591 | 0.555 |
| Item_18 | I would expect health technologies to have measures in place to keep my information safe. | Digital Trust | 5.92 | 0.409 | 0.513 |
| Item_19 | I would trust a new health technology to protect my personal information. | Digital Trust | 4.55 | 0.591 | 0.629 |
| Item_20 | I worry that using a new health technology would put me at risk of fraud. | Digital Trust | 5.32 | 0.405 | 0.350 |
| Item_21 | I would trust a new health technology with information about my health conditions. | Digital Trust | 4.89 | 0.482 | 0.540 |
| Item_22 | Select Strongly Disagree for this question. | Attention Check | 1.00 | NA | NA |
| Item_23 | Select Strongly Agree for this question. | Attention Check | 7.00 | NA | NA |
| Item_24 | I am confident I could learn how to use a fitness app if I wanted to. | Digital Self-Efficacy | 6.32 | 0.484 | 0.605 |
| Item_25 | I am confident I could use a fitness app to monitor my health if I wanted to. | Digital Self-Efficacy | 6.31 | 0.483 | 0.611 |
| Item_26 | I am confident I could use a fitness app regularly if I wanted to. | Digital Self-Efficacy | 5.85 | 0.448 | 0.694 |
| Item_27 | I am confident I could use a fitness app without help if I wanted to. | Digital Self-Efficacy | 6.09 | 0.496 | 0.511 |
| Item_28 | I am confident I could troubleshoot basic issues with a fitness app if I wanted to. | Digital Self-Efficacy | 5.58 | 0.400 | 0.444 |
| Item_29 | I am confident I could use the advanced features of a fitness app if I wanted to. | Digital Self-Efficacy | 5.82 | 0.532 | 0.451 |
| Item_30 | I would use a fitness app because I want to learn about my health. | Digital Behavioural Regulation | 5.35 | 0.541 | 0.782 |
| Item_31 | Because I am not interested in using technology to support my health, I wouldn't use a fitness app. | Digital Behavioural Regulation | 5.58 | 0.561 | 0.853 |
| Item_32 | I wouldn't use a a fitness app because I find technology frustrating. | Digital Behavioural Regulation | 6.00 | 0.361 | 0.633 |
| Item_33 | I would use a fitness app because I am motivated to improve my health. | Digital Behavioural Regulation | 5.46 | 0.575 | 0.819 |
| Item_34 | I would use a fitness app because I don't want to let others down. | Digital Behavioural Regulation | 5.55 | -0.055 | -0.143 |
| Item_35 | I would enjoy using a fitness app to improve my health. | Digital Behavioural Regulation | 5.20 | 0.546 | 0.784 |
| Item_36 | I would use a fitness app because using technology is part of who I am. | Digital Behavioural Regulation | 4.31 | 0.431 | 0.666 |
| Item_37 | I would use a fitness app because I would feel guilty if I didn't. | Digital Behavioural Regulation | 5.63 | 0.028 | -0.007 |
| Item_38 | I can't see why I should bother using a fitness app. | Digital Behavioural Regulation | 5.26 | 0.554 | 0.816 |
| Item_39 | I would use a fitness app if told to by health professionals. | Digital Behavioural Regulation | 5.54 | 0.311 | 0.552 |
| Item_40 | I would use a fitness app, because I find exploring new health technologies exciting. | Digital Behavioural Regulation | 4.60 | 0.516 | 0.739 |
| Item_41 | I would get a sense of accomplishment if I used a fitness app. | Digital Behavioural Regulation | 5.14 | 0.443 | 0.736 |
| Item_42 | I believe that using a fitness app would improve my physical health. | Digital Outcome Expectancy | 5.31 | 0.749 | 0.748 |
| Item_43 | I don't think a fitness app would work for me. | Digital Outcome Expectancy | 5.43 | 0.697 | 0.839 |
| Item_44 | I believe that using a fitness app would be good for me. | Digital Outcome Expectancy | 5.43 | 0.757 | 0.836 |
| Item_45 | I believe that using a fitness app would lead to me living a healthier lifestyle. | Digital Outcome Expectancy | 5.32 | 0.708 | 0.674 |
| Item_46 | I believe that using a fitness app would be good for my mental health. | Digital Outcome Expectancy | 4.91 | 0.716 | 0.723 |
| Item_47 | I believe I would see improvements to my quality of life if I used a fitness app. | Digital Outcome Expectancy | 4.97 | 0.673 | 0.773 |
| Item_48 | Select Strongly Agree for this question. | Attention Check | 6.91 | NA | NA |
| Item_49 | Select Strongly Disagree for this question. | Attention Check | 1.00 | NA | NA |
Factor Analysis
Factor Analysis Adequacy Tests:Kaiser-Meyer-Olkin (KMO) Overall MSA: 0.746 Bartlett's Test of Sphericity p-value: 2.259735e-166 Scree plot
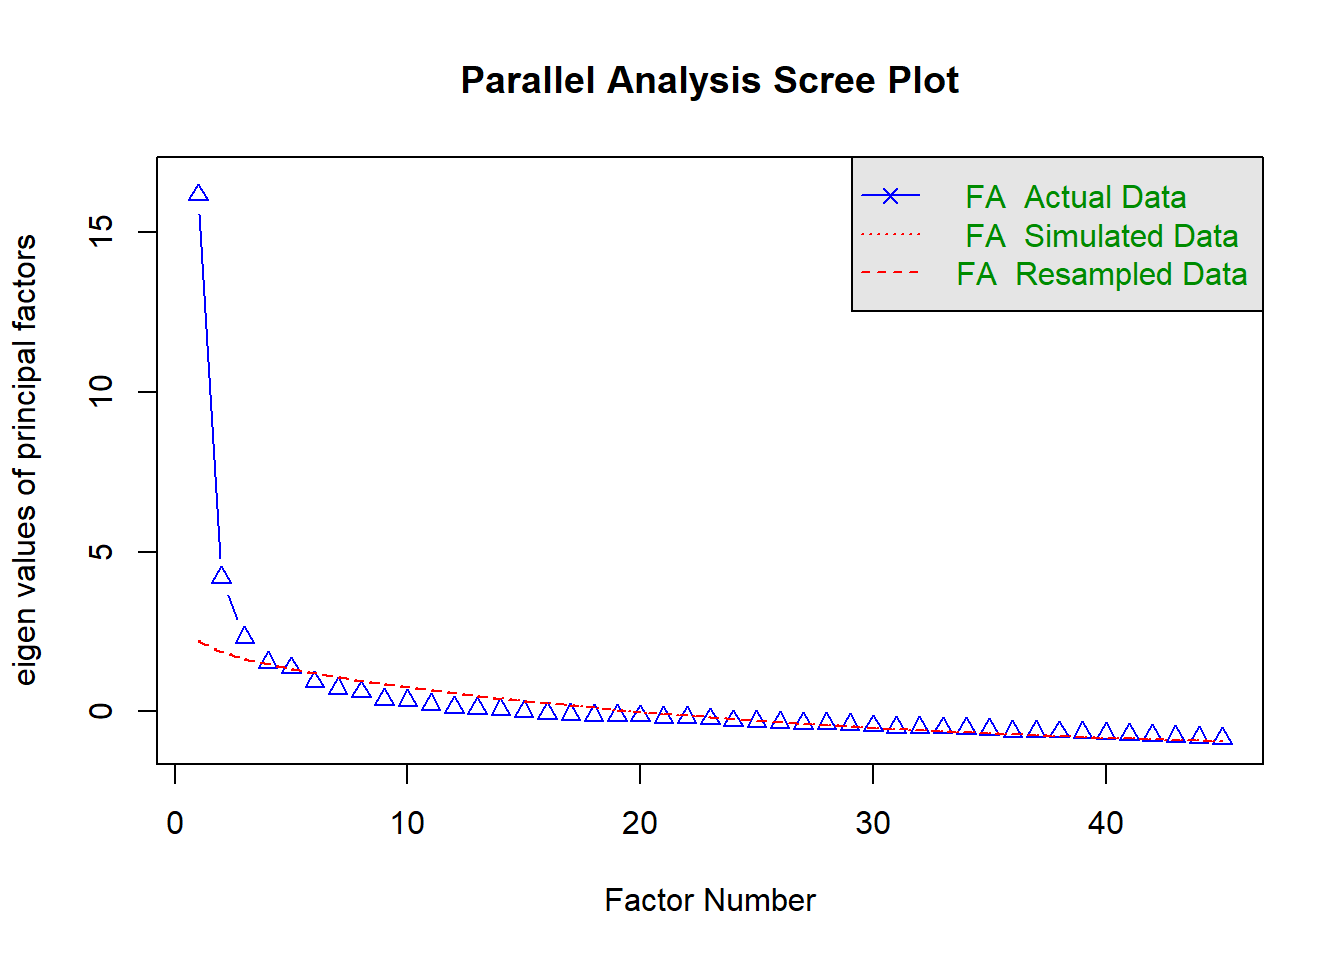
Parallel analysis suggests that the number of factors = 3 and the number of components = NA Parallel Analysis suggests 3 factorsFactor Analysis using method = ml
Call: fa(r = fa_data, nfactors = n_factors_pa, rotate = "oblimin",
scores = TRUE, fm = "ml")
Standardized loadings (pattern matrix) based upon correlation matrix
item ML1 ML2 ML3 h2 u2 com
Item_33 31 0.91 0.851 0.15 1.0
Item_35 33 0.89 0.788 0.21 1.0
Item_44 42 0.85 0.882 0.12 1.2
Item_38 36 0.84 0.749 0.25 1.1
Item_31 29 0.83 0.819 0.18 1.1
Item_11 11 0.83 0.686 0.31 1.2
Item_42 40 0.83 0.773 0.23 1.3
Item_43 41 0.82 0.818 0.18 1.2
Item_46 44 0.81 0.713 0.29 1.1
Item_41 39 0.80 0.700 0.30 1.1
Item_30 28 0.80 0.732 0.27 1.2
Item_47 45 0.78 0.662 0.34 1.1
Item_45 43 0.74 0.659 0.34 1.4
Item_40 38 0.74 0.614 0.39 1.1
Item_21 21 0.70 0.437 0.56 1.1
Item_39 37 0.64 0.400 0.60 1.2
Item_16 16 0.64 0.391 0.61 1.6
Item_19 19 0.64 0.449 0.55 1.3
Item_17 17 0.63 0.438 0.56 1.6
Item_36 34 0.56 0.481 0.52 1.4
Item_14 14 0.47 0.226 0.77 1.1
Item_18 18 0.39 0.227 0.77 1.3
Item_12 12 0.39 0.233 0.77 1.5
Item_20 20 0.125 0.88 2.1
Item_8 8 0.93 0.780 0.22 1.0
Item_7 7 0.83 0.649 0.35 1.1
Item_29 27 0.77 0.628 0.37 1.0
Item_1 1 0.64 0.479 0.52 1.1
Item_9 9 0.64 0.418 0.58 1.1
Item_28 26 0.62 0.446 0.55 1.3
Item_27 25 0.62 0.483 0.52 1.2
Item_24 22 0.59 0.523 0.48 1.3
Item_10 10 0.58 0.51 0.716 0.28 2.0
Item_6 6 0.58 0.506 0.49 1.4
Item_25 23 0.34 0.45 0.450 0.55 1.9
Item_2 2 0.31 0.115 0.88 2.0
Item_3 3 0.30 0.092 0.91 1.5
Item_4 4 0.57 0.510 0.49 1.5
Item_37 35 0.55 0.297 0.70 1.2
Item_32 30 0.30 0.38 0.51 0.677 0.32 2.5
Item_26 24 0.37 0.34 0.50 0.705 0.30 2.7
Item_34 32 0.47 0.269 0.73 1.7
Item_13 13 0.36 0.198 0.80 1.8
Item_5 5 0.33 0.295 0.71 2.6
Item_15 15 0.047 0.95 1.2
ML1 ML2 ML3
SS loadings 13.84 6.32 2.97
Proportion Var 0.31 0.14 0.07
Cumulative Var 0.31 0.45 0.51
Proportion Explained 0.60 0.27 0.13
Cumulative Proportion 0.60 0.87 1.00
With factor correlations of
ML1 ML2 ML3
ML1 1.00 0.35 0.17
ML2 0.35 1.00 0.15
ML3 0.17 0.15 1.00
Mean item complexity = 1.4
Test of the hypothesis that 3 factors are sufficient.
df null model = 990 with the objective function = 57.26 with Chi Square = 2757.89
df of the model are 858 and the objective function was 27.82
The root mean square of the residuals (RMSR) is 0.08
The df corrected root mean square of the residuals is 0.09
The harmonic n.obs is 65 with the empirical chi square 806.6 with prob < 0.89
The total n.obs was 65 with Likelihood Chi Square = 1284.24 with prob < 1.5e-19
Tucker Lewis Index of factoring reliability = 0.703
RMSEA index = 0.086 and the 90 % confidence intervals are 0.078 0.098
BIC = -2297.38
Fit based upon off diagonal values = 0.96
Measures of factor score adequacy
ML1 ML2 ML3
Correlation of (regression) scores with factors 0.99 0.97 0.94
Multiple R square of scores with factors 0.98 0.94 0.87
Minimum correlation of possible factor scores 0.96 0.88 0.75| Item | Item_Text | Theoretical_Construct | ML1 | ML2 | ML3 | Communality | Uniqueness |
|---|---|---|---|---|---|---|---|
| Item_33 | I would use a fitness app because I am motivated to improve my health. | Digital Behavioural Regulation | 0.914 | 0.851 | 0.149 | ||
| Item_35 | I would enjoy using a fitness app to improve my health. | Digital Behavioural Regulation | 0.889 | 0.788 | 0.212 | ||
| Item_44 | I believe that using a fitness app would be good for me. | Digital Outcome Expectancy | 0.849 | 0.882 | 0.118 | ||
| Item_38 | I can't see why I should bother using a fitness app. | Digital Behavioural Regulation | 0.840 | 0.749 | 0.251 | ||
| Item_31 | Because I am not interested in using technology to support my health, I wouldn't use a fitness app. | Digital Behavioural Regulation | 0.834 | 0.819 | 0.181 | ||
| Item_11 | Those close to me would encourage me to use a new health technology. | Sociodigital Influences | 0.833 | 0.686 | 0.314 | ||
| Item_42 | I believe that using a fitness app would improve my physical health. | Digital Outcome Expectancy | 0.826 | 0.773 | 0.227 | ||
| Item_43 | I don't think a fitness app would work for me. | Digital Outcome Expectancy | 0.819 | 0.818 | 0.182 | ||
| Item_46 | I believe that using a fitness app would be good for my mental health. | Digital Outcome Expectancy | 0.814 | 0.713 | 0.287 | ||
| Item_41 | I would get a sense of accomplishment if I used a fitness app. | Digital Behavioural Regulation | 0.804 | 0.700 | 0.300 | ||
| Item_30 | I would use a fitness app because I want to learn about my health. | Digital Behavioural Regulation | 0.802 | 0.732 | 0.268 | ||
| Item_47 | I believe I would see improvements to my quality of life if I used a fitness app. | Digital Outcome Expectancy | 0.784 | 0.662 | 0.338 | ||
| Item_45 | I believe that using a fitness app would lead to me living a healthier lifestyle. | Digital Outcome Expectancy | 0.740 | 0.659 | 0.341 | ||
| Item_40 | I would use a fitness app, because I find exploring new health technologies exciting. | Digital Behavioural Regulation | 0.740 | 0.614 | 0.386 | ||
| Item_21 | I would trust a new health technology with information about my health conditions. | Digital Trust | 0.703 | 0.437 | 0.563 | ||
| Item_39 | I would use a fitness app if told to by health professionals. | Digital Behavioural Regulation | 0.645 | 0.400 | 0.600 | ||
| Item_16 | Others would be pleased I was using a health technology. | Sociodigital Influences | 0.640 | 0.391 | 0.609 | ||
| Item_19 | I would trust a new health technology to protect my personal information. | Digital Trust | 0.637 | 0.449 | 0.551 | ||
| Item_17 | I would trust a new health technology with my personal details. | Digital Trust | 0.631 | 0.438 | 0.562 | ||
| Item_36 | I would use a fitness app because using technology is part of who I am. | Digital Behavioural Regulation | 0.560 | 0.481 | 0.519 | ||
| Item_14 | I feel like using health technology is expected these days. | Sociodigital Influences | 0.465 | 0.226 | 0.774 | ||
| Item_18 | I would expect health technologies to have measures in place to keep my information safe. | Digital Trust | 0.388 | 0.227 | 0.773 | ||
| Item_12 | Those close to me would help me use a new health technology if needed. | Sociodigital Influences | 0.386 | 0.233 | 0.767 | ||
| Item_20 | I worry that using a new health technology would put me at risk of fraud. | Digital Trust | 0.125 | 0.875 | |||
| Item_8 | I can troubleshoot basic issues with digital technology. | Digital Skills | 0.926 | 0.780 | 0.220 | ||
| Item_7 | I can usually use digital technology. | Digital Skills | 0.827 | 0.649 | 0.351 | ||
| Item_29 | I am confident I could use the advanced features of a fitness app if I wanted to. | Digital Self-Efficacy | 0.772 | 0.628 | 0.372 | ||
| Item_1 | I would understand what a health technology was asking me to do to improve my health. | Digital Health Literacy | 0.639 | 0.479 | 0.521 | ||
| Item_9 | I often struggle to use digital technology. | Digital Skills | 0.636 | 0.418 | 0.582 | ||
| Item_28 | I am confident I could troubleshoot basic issues with a fitness app if I wanted to. | Digital Self-Efficacy | 0.623 | 0.446 | 0.554 | ||
| Item_27 | I am confident I could use a fitness app without help if I wanted to. | Digital Self-Efficacy | 0.622 | 0.483 | 0.517 | ||
| Item_24 | I am confident I could learn how to use a fitness app if I wanted to. | Digital Self-Efficacy | 0.591 | 0.523 | 0.477 | ||
| Item_10 | I can usually adjust the settings on digital technology to suit my needs. | Digital Skills | 0.578 | 0.511 | 0.716 | 0.284 | |
| Item_6 | I can usually download apps. | Digital Skills | 0.575 | 0.506 | 0.494 | ||
| Item_25 | I am confident I could use a fitness app to monitor my health if I wanted to. | Digital Self-Efficacy | 0.341 | 0.454 | 0.450 | 0.550 | |
| Item_2 | I can usually work out if health information online is reliable. | Digital Health Literacy | 0.311 | 0.115 | 0.885 | ||
| Item_3 | I usually know when health information online is wrong. | Digital Health Literacy | 0.305 | 0.092 | 0.908 | ||
| Item_4 | I would understand information about my health from health technologies. | Digital Health Literacy | 0.571 | 0.510 | 0.490 | ||
| Item_37 | I would use a fitness app because I would feel guilty if I didn't. | Digital Behavioural Regulation | 0.547 | 0.297 | 0.703 | ||
| Item_32 | I wouldn't use a a fitness app because I find technology frustrating. | Digital Behavioural Regulation | 0.300 | 0.380 | 0.505 | 0.677 | 0.323 |
| Item_26 | I am confident I could use a fitness app regularly if I wanted to. | Digital Self-Efficacy | 0.375 | 0.340 | 0.497 | 0.705 | 0.295 |
| Item_34 | I would use a fitness app because I don't want to let others down. | Digital Behavioural Regulation | 0.467 | 0.269 | 0.731 | ||
| Item_13 | I don't have anyone in my life that could help me use a health technology. | Sociodigital Influences | 0.361 | 0.198 | 0.802 | ||
| Item_5 | I would know which health technology was right for me. | Digital Health Literacy | 0.332 | 0.295 | 0.705 | ||
| Item_15 | Few people I know use health technologies. | Sociodigital Influences | 0.047 | 0.953 |
Factor Correlations:| ML1 | ML2 | ML3 | |
|---|---|---|---|
| ML1 | 1.000 | 0.352 | 0.167 |
| ML2 | 0.352 | 1.000 | 0.147 |
| ML3 | 0.167 | 0.147 | 1.000 |
Model Fit Statistics:Chi-square: 806.6 df: 858 p-value: 1.474695e-19 RMSEA: 0.086 TLI: 0.703 BIC: -2297.38
Cronbach's Alpha by Theoretical Sub-Construct:Digital Health Literacy : 0.581
Digital Skills : 0.828
Sociodigital Influences : 0.624
Digital Trust : 0.83
Digital Self-Efficacy : 0.832
Some items ( Item_34 Item_37 ) were negatively correlated with the total scale and
probably should be reversed.
To do this, run the function again with the 'check.keys=TRUE' optionDigital Behavioural Regulation : 0.892
Digital Outcome Expectancy : 0.935